Open Access
Fig. 8
Download original image
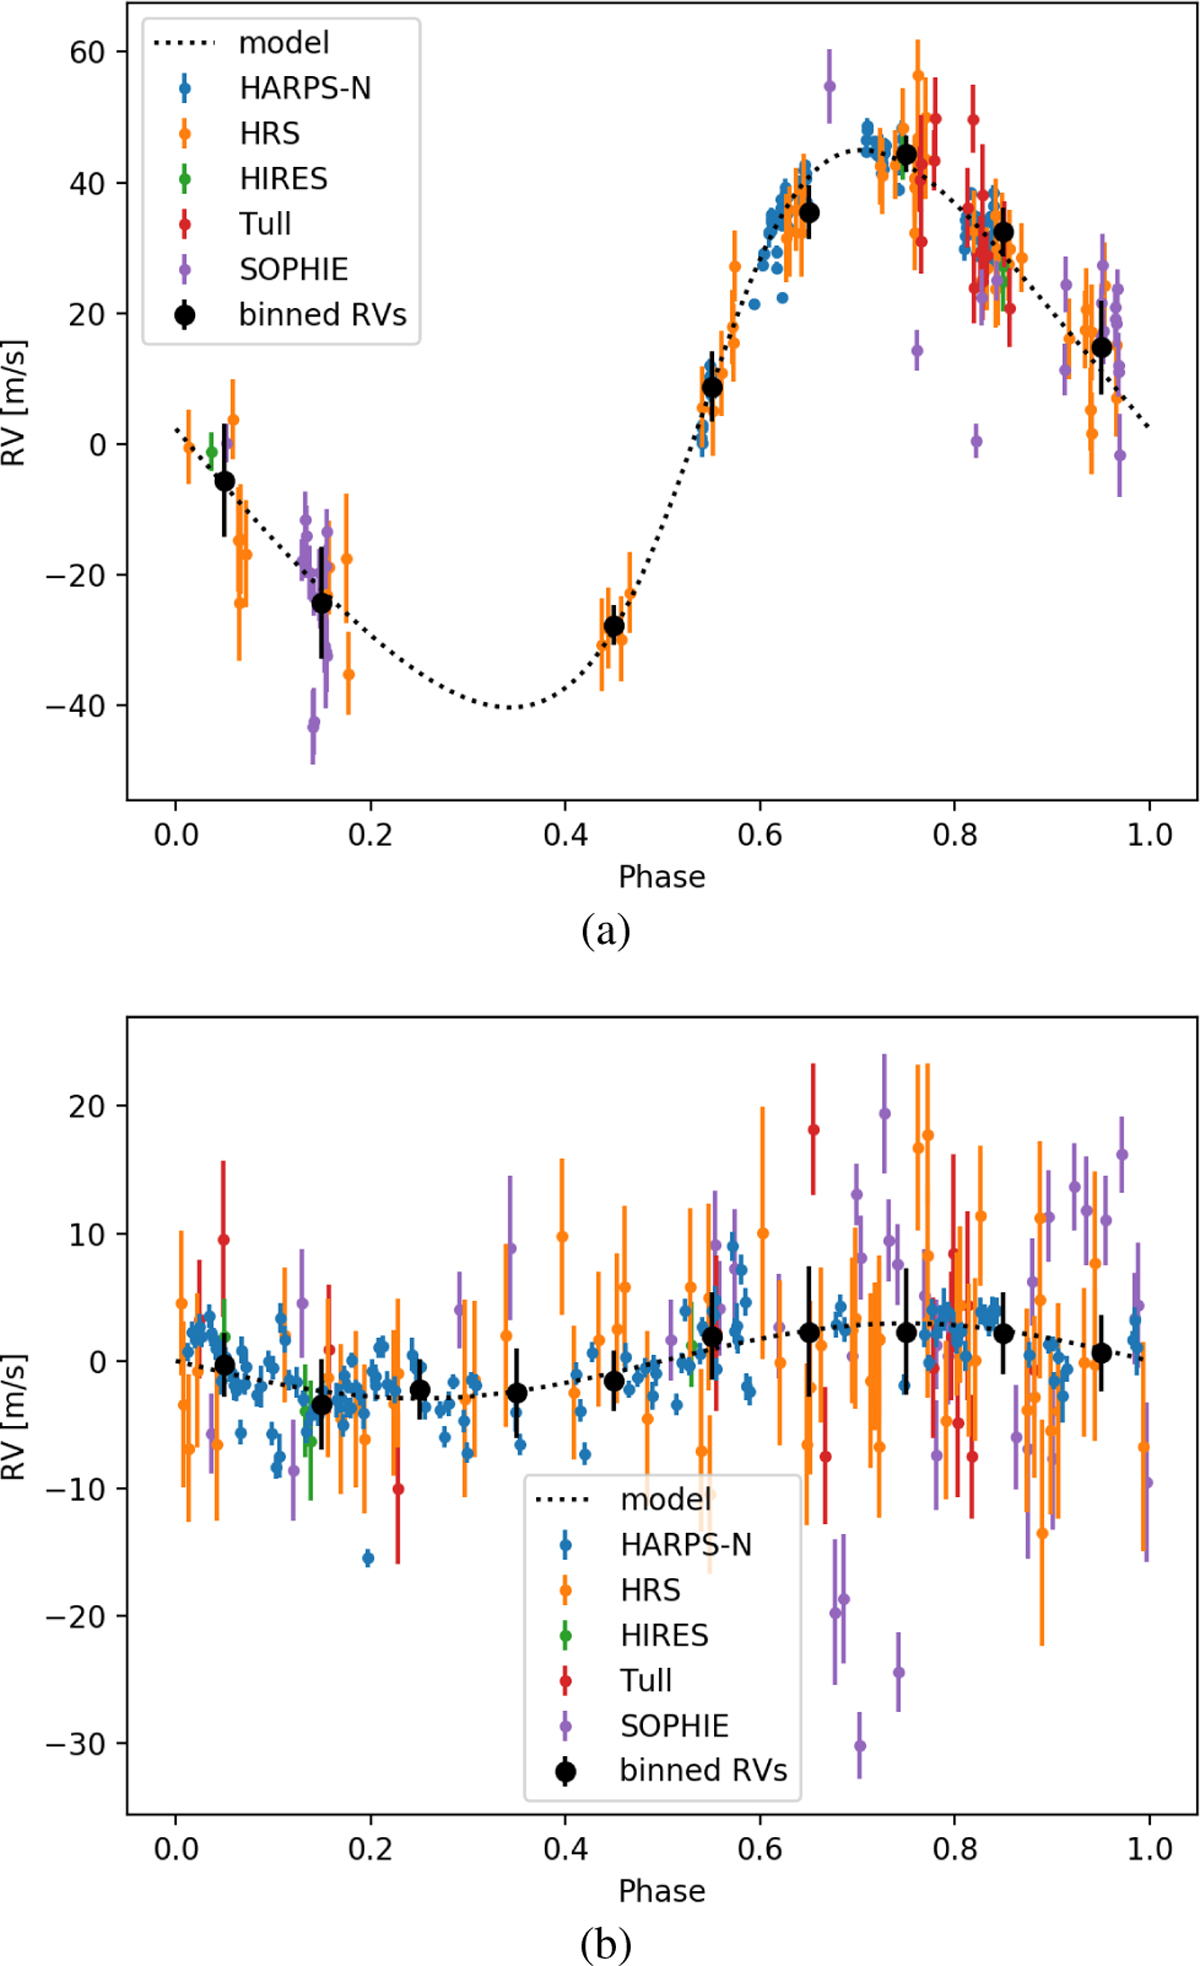
GJ 328: phase-folded RV signal of GJ 328 b (upper panel) and GJ 328 c (lower panel). The black points and error bars represent the binned weighted averages and standard deviations of the data.
Current usage metrics show cumulative count of Article Views (full-text article views including HTML views, PDF and ePub downloads, according to the available data) and Abstracts Views on Vision4Press platform.
Data correspond to usage on the plateform after 2015. The current usage metrics is available 48-96 hours after online publication and is updated daily on week days.
Initial download of the metrics may take a while.