Open Access
Fig. 6
Download original image
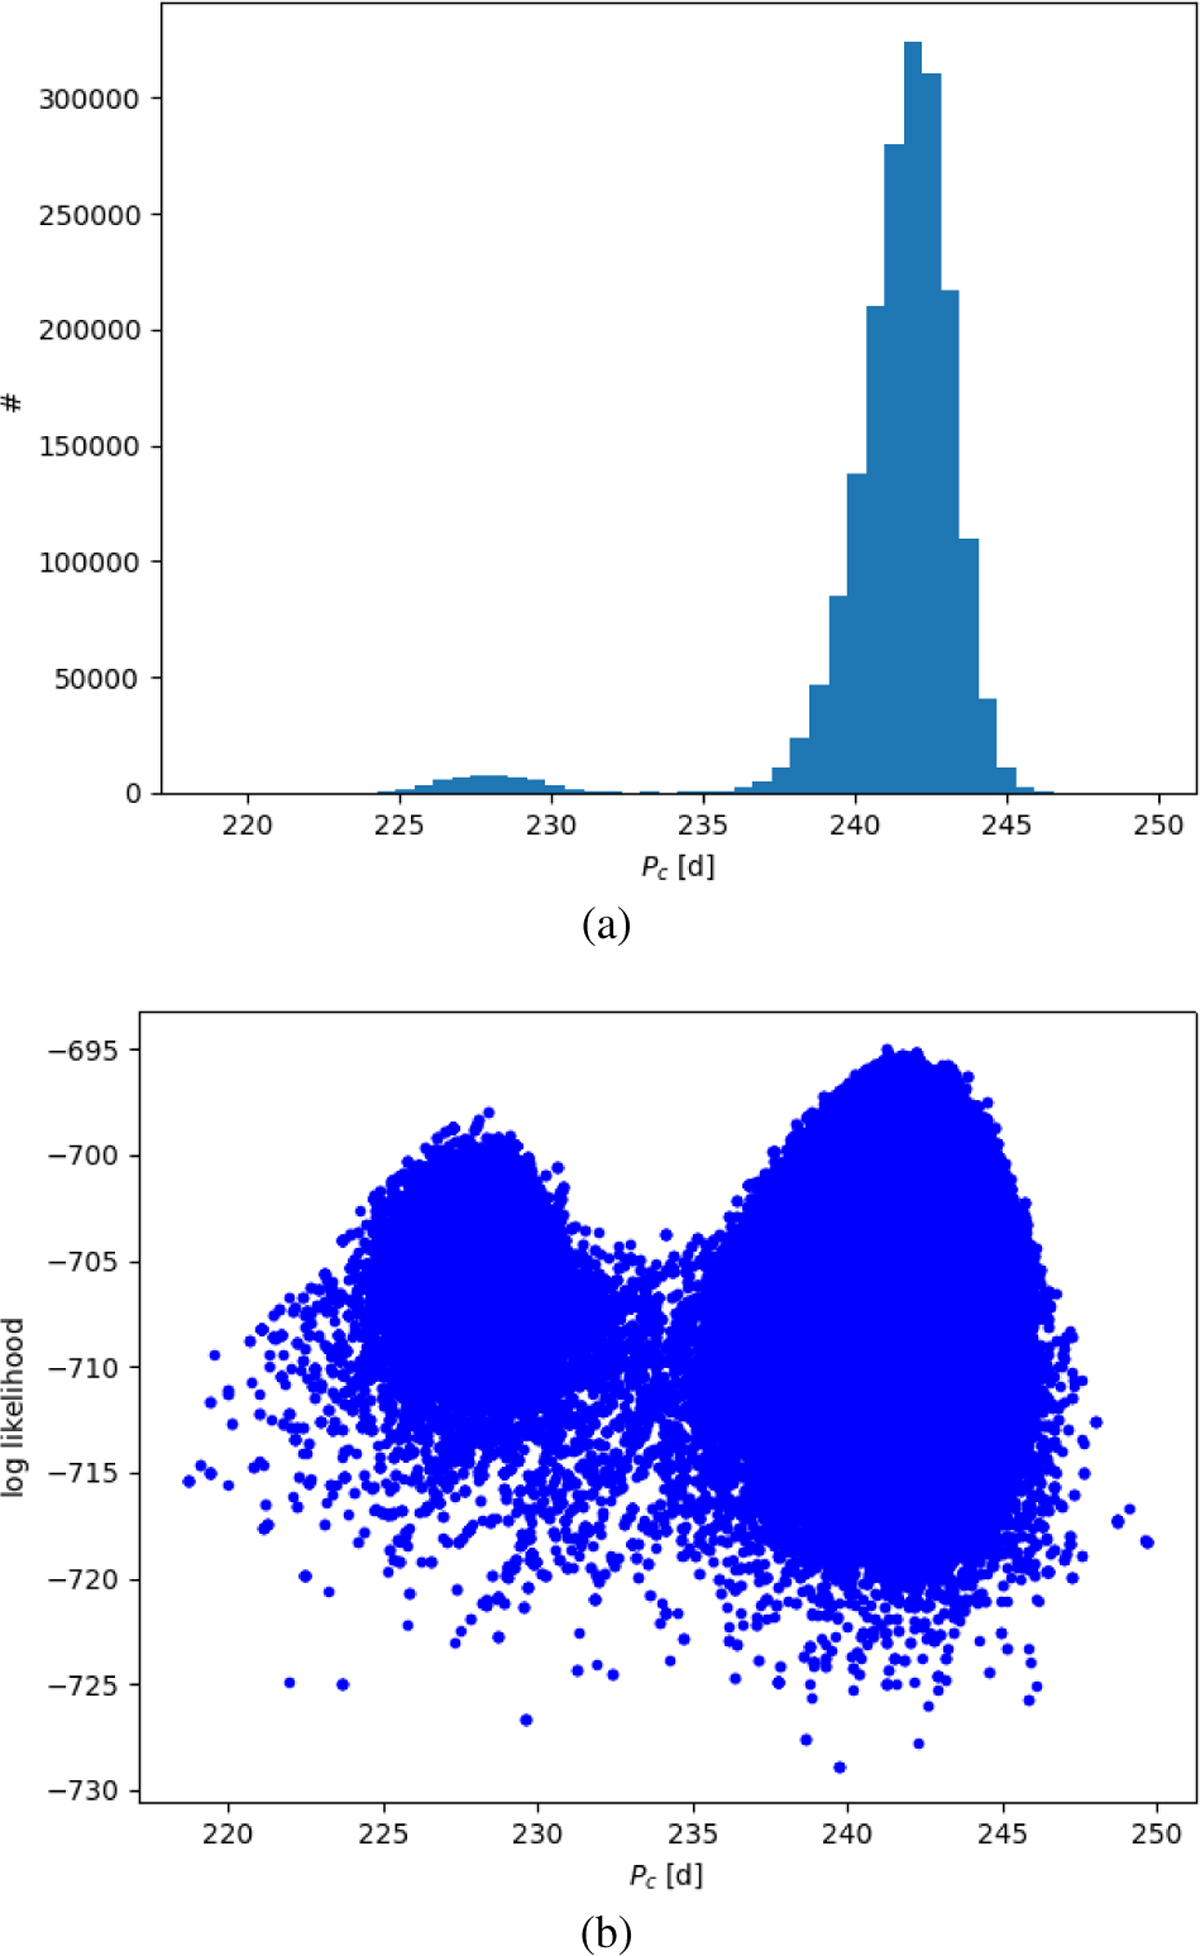
GJ 328: comparison of Pc = 227 days and Pc = 242 days signals in the two-Keplerian model, shown as the histogram of the posterior distribution of Pc (top panel), and the log-likelihood as a function of Pc (bottom panel).
Current usage metrics show cumulative count of Article Views (full-text article views including HTML views, PDF and ePub downloads, according to the available data) and Abstracts Views on Vision4Press platform.
Data correspond to usage on the plateform after 2015. The current usage metrics is available 48-96 hours after online publication and is updated daily on week days.
Initial download of the metrics may take a while.