Open Access
Fig. 4
Download original image
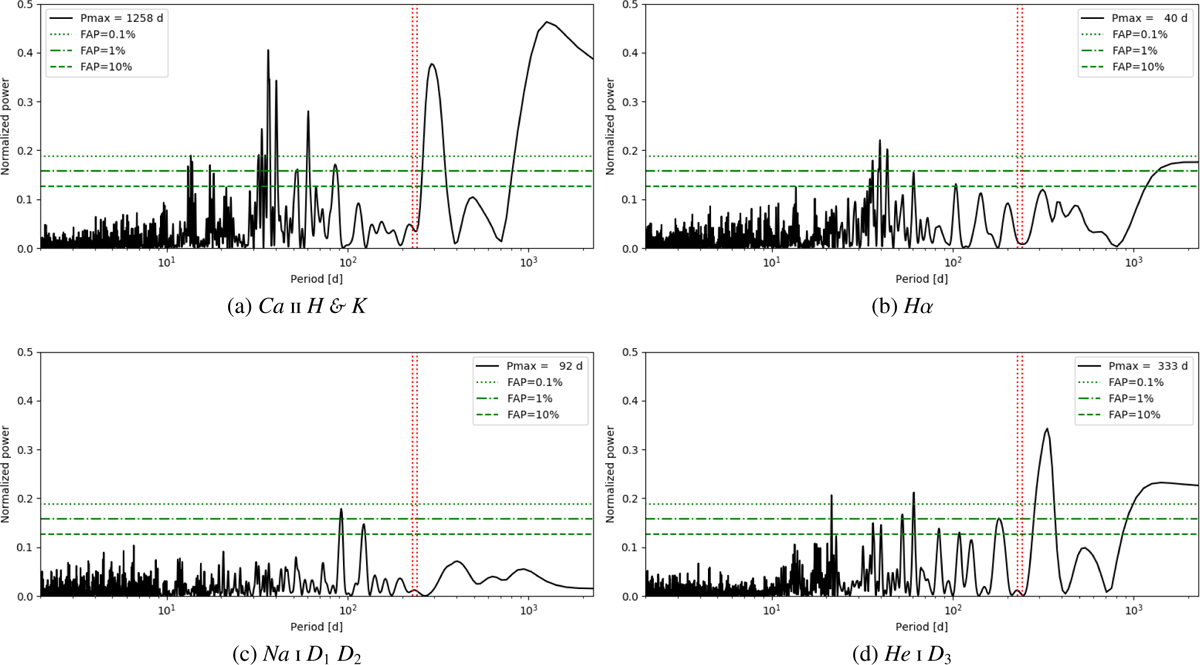
GJ 328: GLS periodograms of HARPS-N activity indexes computed following the procedure by Gomes da Silva et al. (2011). The red dotted vertical lines indicate the 227–242 days period of the signals identified in the RV residuals. The horizontal lines indicate the FAP levels as in Fig. 2b.
Current usage metrics show cumulative count of Article Views (full-text article views including HTML views, PDF and ePub downloads, according to the available data) and Abstracts Views on Vision4Press platform.
Data correspond to usage on the plateform after 2015. The current usage metrics is available 48-96 hours after online publication and is updated daily on week days.
Initial download of the metrics may take a while.