Fig. 9
Download original image
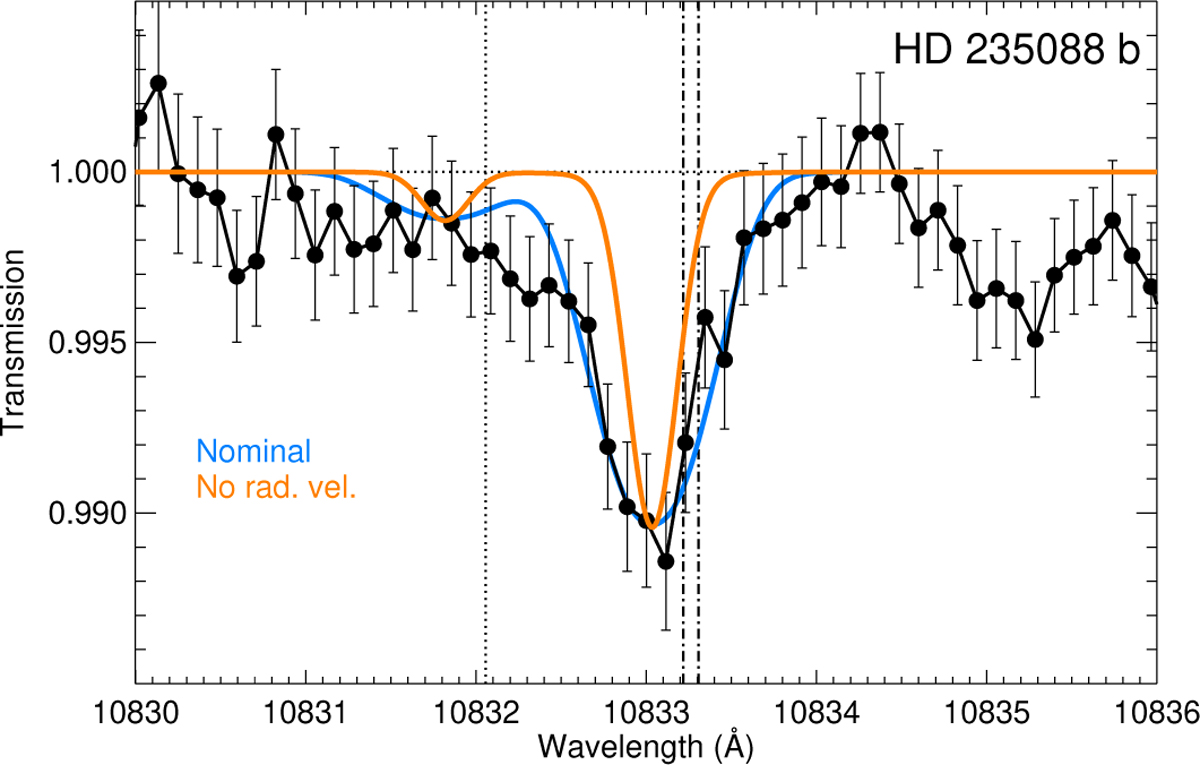
Transmission spectrum of the He I triplet during transit. Measured absorption (solid dots) and estimated errors are shown in black (light gray data in the bottom/right panel of Fig. 6, but binned to half the number of the points and the error reduced by ![]() The orange curve shows the absorption profile when only the temperature and turbulence broadenings are included. The blue curve is the best-fit model obtained for an effective temperature of 3000 K, a mass-loss rate (Ṁ) of 2.4 × 10¹⁰ g s−1 and an H/He ratio of 98/2. The calculation includes a net global wind of −6.6 km s−1, as derived in Sect. 5.3. The positions of the three He I lines are marked by dotted and dash-dotted vertical lines. The wavelengths in this figure are given in vacuum.
The orange curve shows the absorption profile when only the temperature and turbulence broadenings are included. The blue curve is the best-fit model obtained for an effective temperature of 3000 K, a mass-loss rate (Ṁ) of 2.4 × 10¹⁰ g s−1 and an H/He ratio of 98/2. The calculation includes a net global wind of −6.6 km s−1, as derived in Sect. 5.3. The positions of the three He I lines are marked by dotted and dash-dotted vertical lines. The wavelengths in this figure are given in vacuum.
Current usage metrics show cumulative count of Article Views (full-text article views including HTML views, PDF and ePub downloads, according to the available data) and Abstracts Views on Vision4Press platform.
Data correspond to usage on the plateform after 2015. The current usage metrics is available 48-96 hours after online publication and is updated daily on week days.
Initial download of the metrics may take a while.