Fig. 8
Download original image
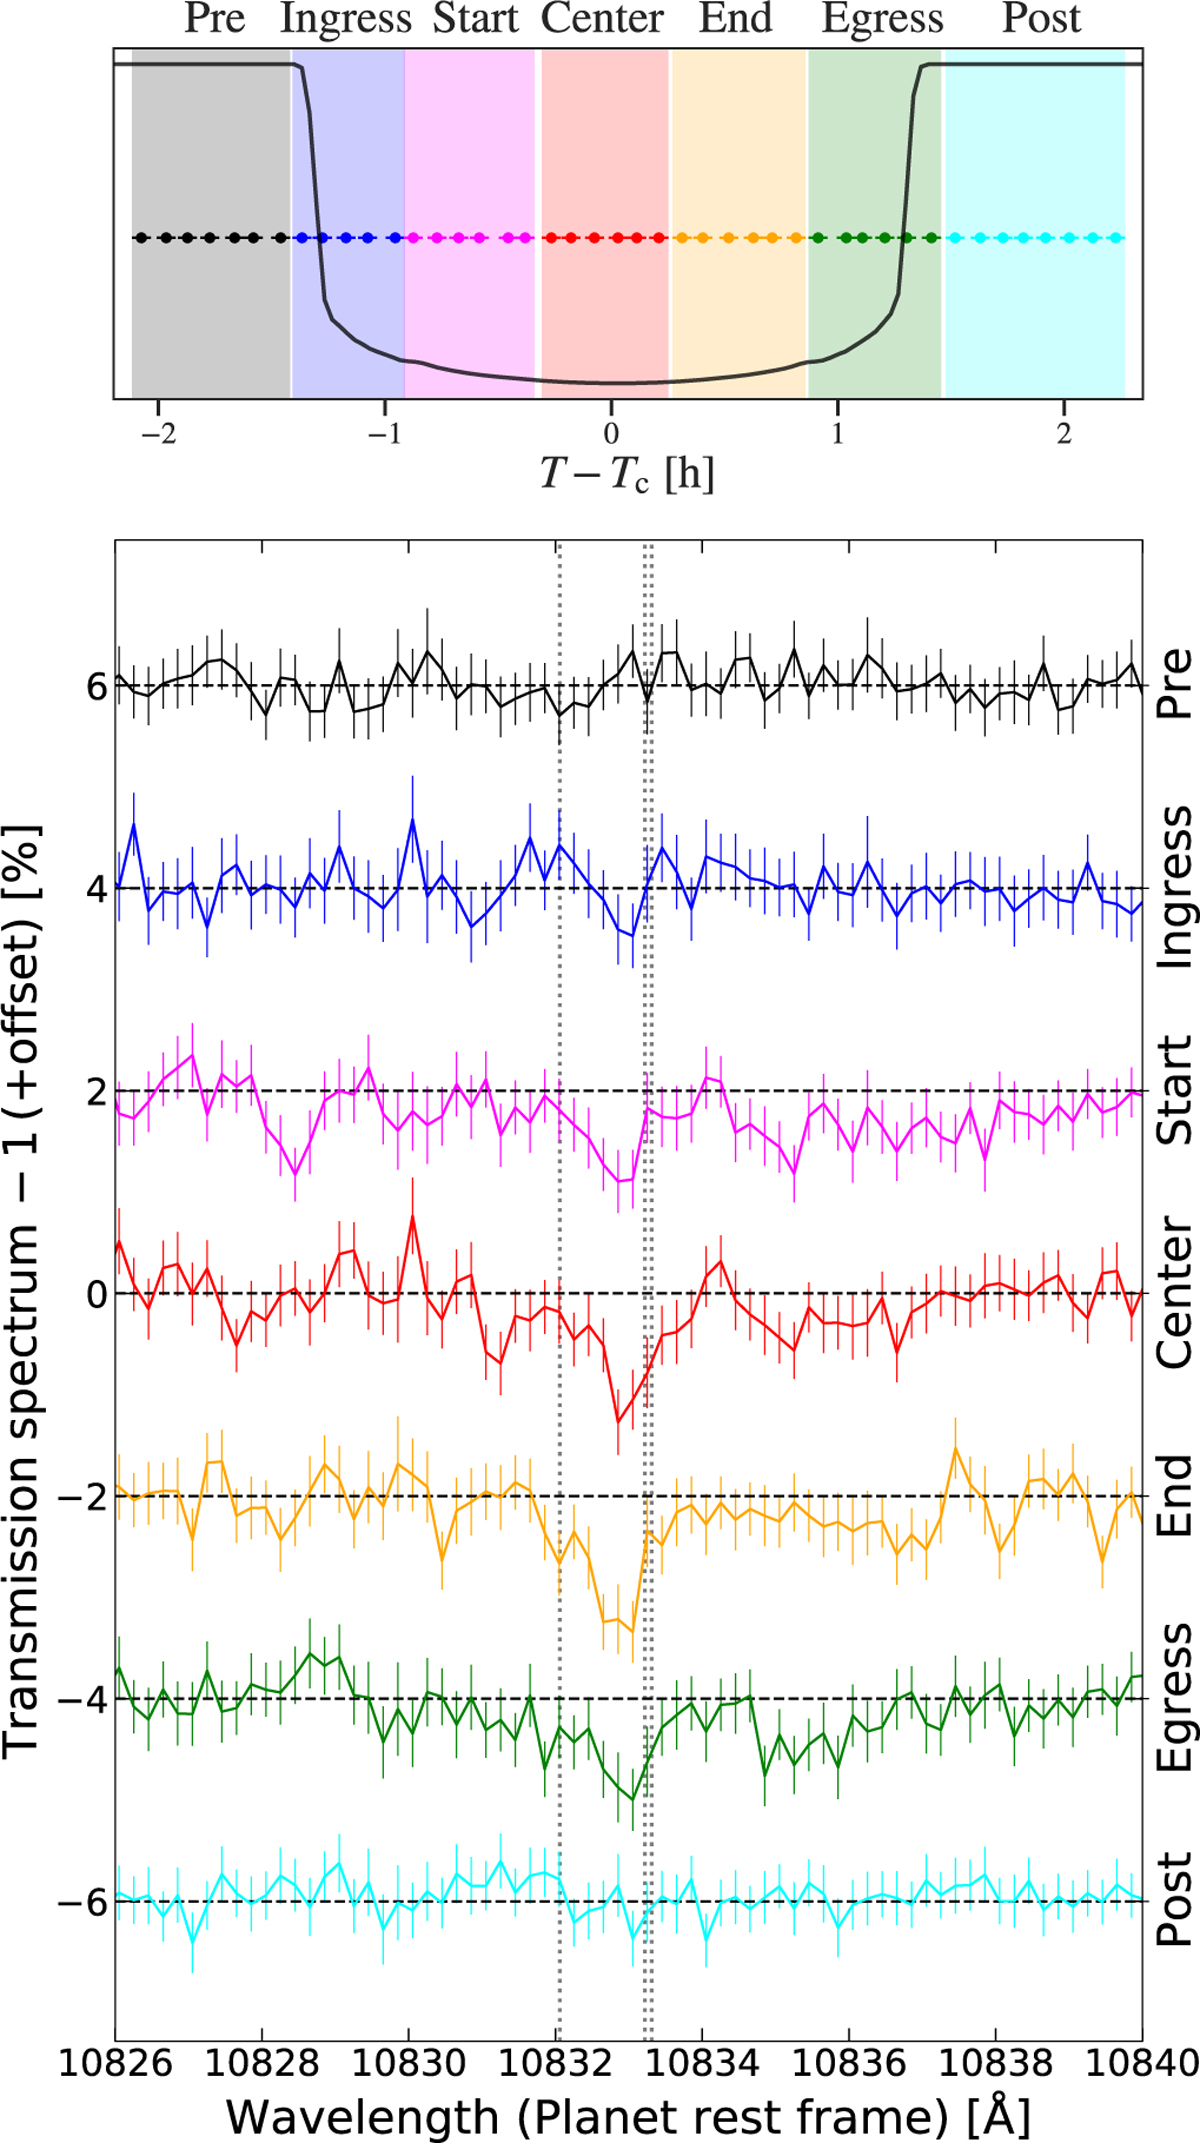
Temporal evolution of the He I signal. Top panel: color scheme for the CARMENES spectra: pre-transit (black), ingress (blue), start (magenta), center (red), end (orange), egress (green), and post-transit (cyan). Horizontal bars represent the 5 min duration of the exposures. The transit model for HD 235088 b from Juliet (black solid line) is superimposed. Bottom panel: transmission spectra (TS) around the He I triplet line for the transit phases from top to bottom (consecutively offset by 2%). We show each TS binned by 0.2 Å with its uncertainties. Dashed black horizontal lines indicate the 0% level in each case, and dotted grey vertical line indicate the He I triplet line position. The wavelengths in this figure are given in vacuum.
Current usage metrics show cumulative count of Article Views (full-text article views including HTML views, PDF and ePub downloads, according to the available data) and Abstracts Views on Vision4Press platform.
Data correspond to usage on the plateform after 2015. The current usage metrics is available 48-96 hours after online publication and is updated daily on week days.
Initial download of the metrics may take a while.