Fig. 6
Download original image
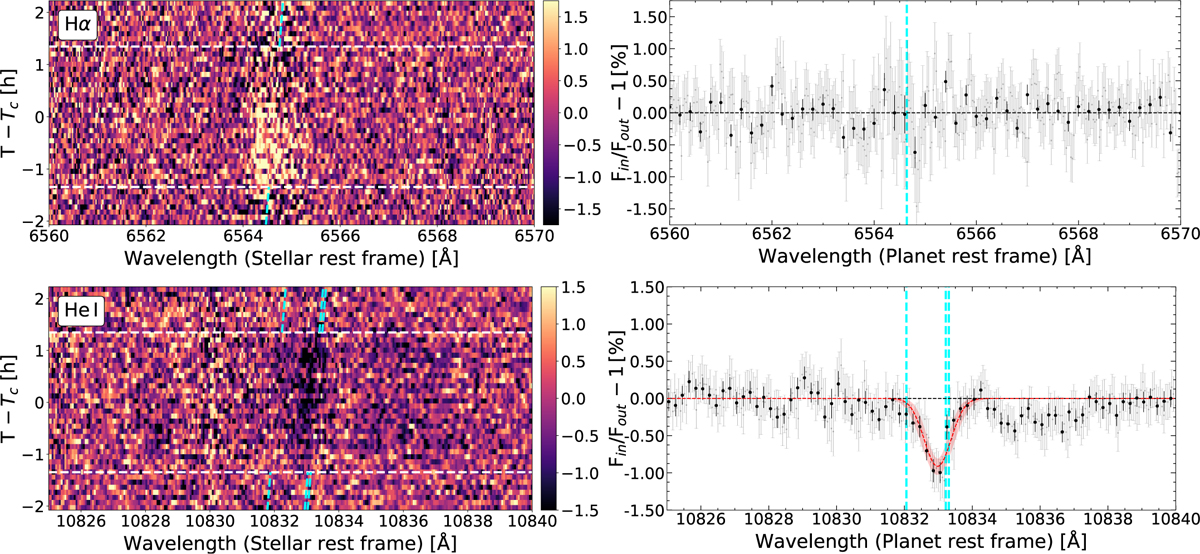
Residual maps and transmission spectra around Hα (top panels) and He I NIR (bottom panels) lines. Left panels: residual maps in the stellar rest frame. The time since mid-transit time (Tc) is shown on the vertical axis, wavelength is on the horizontal axis, and relative absorption is color-coded. Dashed white horizontal lines indicate the first and fourth contacts. Cyan lines show the theoretical trace of the planetary signals. Right panels: transmission spectra obtained combining all the spectra, uncontaminated from stellar activity, between the first and fourth contacts. We show the original data in light gray and the data binned by 0.2 Å in black. The best Gaussian fit model is shown in red along with its lσ uncertainties (shaded red region). Dotted cyan vertical lines indicate the Hα (top) and the He I triplet (bottom) lines positions. All wavelengths in this figure are given in vacuum.
Current usage metrics show cumulative count of Article Views (full-text article views including HTML views, PDF and ePub downloads, according to the available data) and Abstracts Views on Vision4Press platform.
Data correspond to usage on the plateform after 2015. The current usage metrics is available 48-96 hours after online publication and is updated daily on week days.
Initial download of the metrics may take a while.