Fig. D.1
Download original image
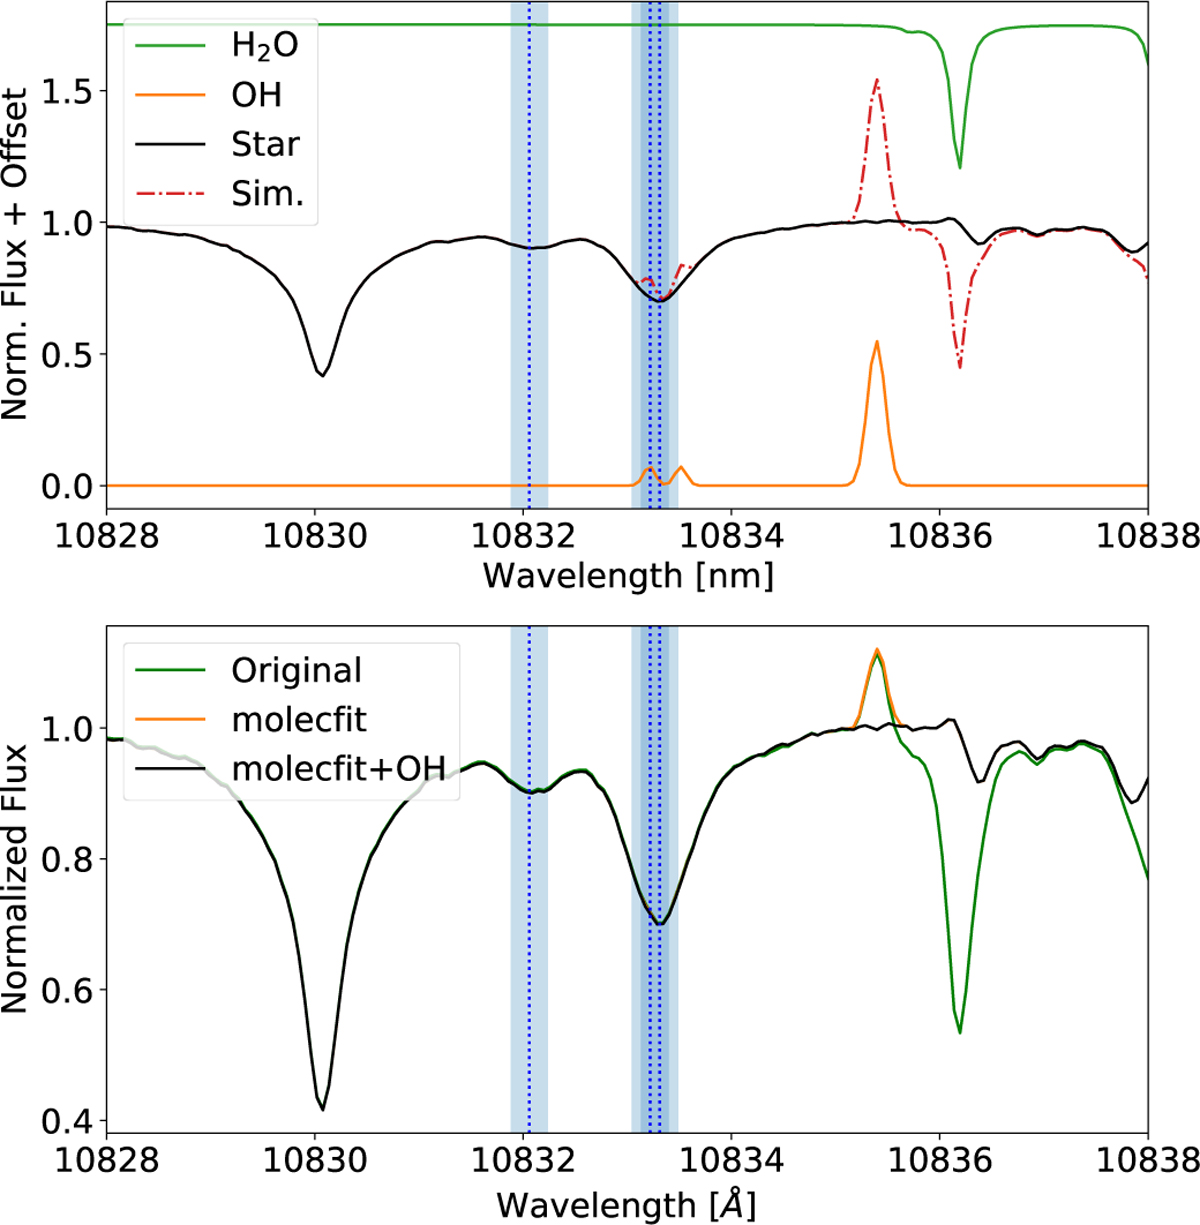
Telluric contamination close to the He I triplet lines. Upper panel: Simulation of the contamination of the spectrum of HD 235088 by H2O absorption and OH emission during the night of 6 August 2022. The green curve is a synthetic model of H2O absorption, the orange curve is a synthetic model of OH emission, and the black curve is the average of the normalised HD 235088 spectra. The dashed red line is the combination of synthetic telluric models and the HD 235088 spectrum. Lower panel: Averaged normalised HD 235088 spectra from 6 August 2022 CARMENES observations. Original spectrum is plotted in green, spectrum after molecfit correction is over-plotted in orange, and spectrum after molecfit and OH correction is over-plotted in black. The vertical blue dotted lines indicate the positions of the He I triplet lines, and the blue shaded region represents the planet trace in the stellar rest frame at vacuum wavelength.
Current usage metrics show cumulative count of Article Views (full-text article views including HTML views, PDF and ePub downloads, according to the available data) and Abstracts Views on Vision4Press platform.
Data correspond to usage on the plateform after 2015. The current usage metrics is available 48-96 hours after online publication and is updated daily on week days.
Initial download of the metrics may take a while.