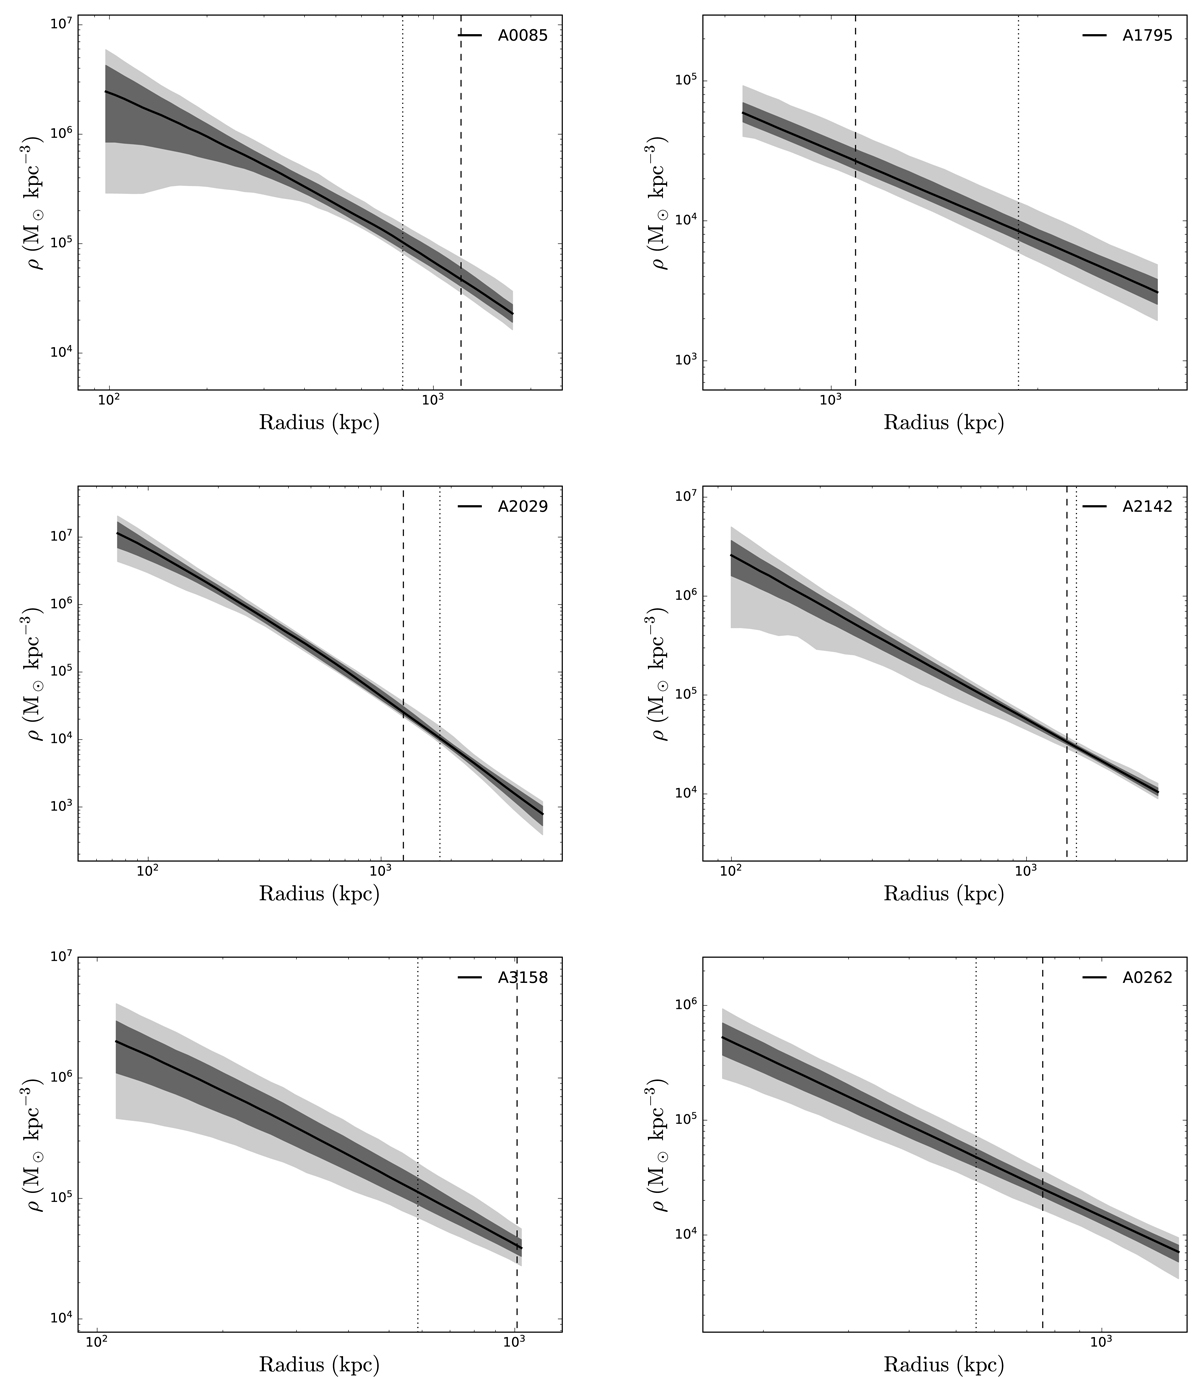
Fig. C.1.
Download original image
Density profiles corresponding to the total cumulative mass profiles in Figure 3. Dark and light shaded areas are 1σ and 2σ regions. Vertical dashed and dotted lines indicate the positions of r500 from X-ray data and Rhalf from optical data. Please note that these are not dark matter density profiles but the total density profiles including baryonic contributions.
Current usage metrics show cumulative count of Article Views (full-text article views including HTML views, PDF and ePub downloads, according to the available data) and Abstracts Views on Vision4Press platform.
Data correspond to usage on the plateform after 2015. The current usage metrics is available 48-96 hours after online publication and is updated daily on week days.
Initial download of the metrics may take a while.