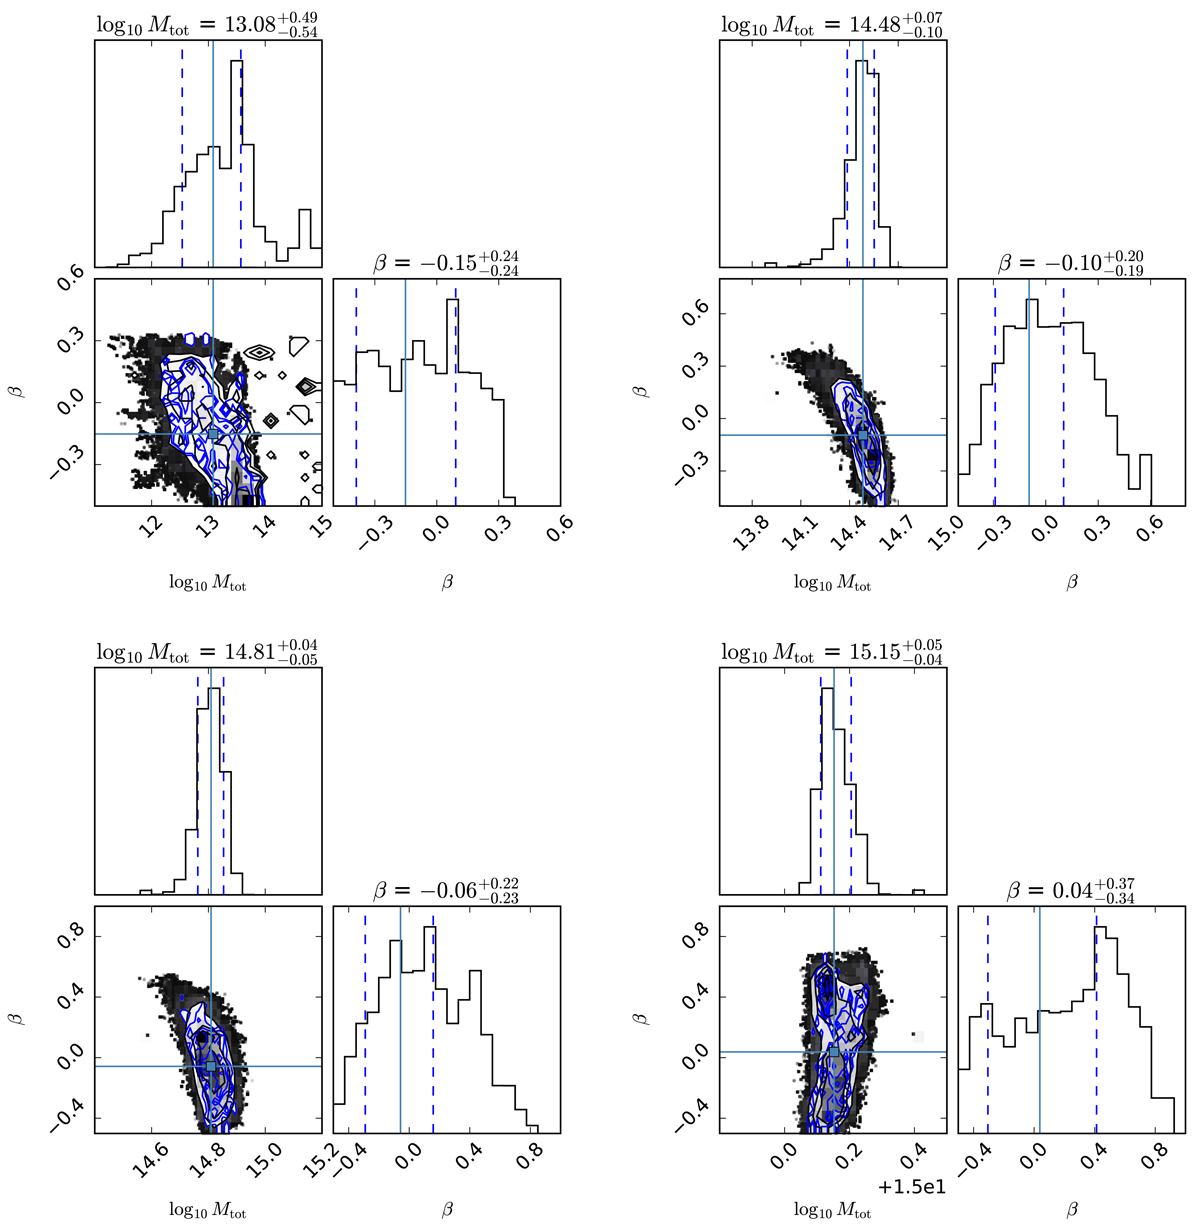
Fig. B.1.
Download original image
Example corner plots for cluster A0085 showing mass-velocity anisotropy degeneracy. The four panels present the posterior distributions of total enclosed mass and velocity anisotropy at four different radii where binned velocity dispersion data are available: r = 96 kpc (top left), r = 570 kpc (top right), r = 965 kpc (bottom left), and r = 1827 kpc (bottom right). Blue marks regions that are used for parameter estimations. Blue crosses indicate the position of the best-fit parameters and vertical dashed lines outline the 1 σ regions. The total enclosed mass is well determined at all radii, while the velocity anisotropy is less constrained at small radii but improves slightly toward large radii.
Current usage metrics show cumulative count of Article Views (full-text article views including HTML views, PDF and ePub downloads, according to the available data) and Abstracts Views on Vision4Press platform.
Data correspond to usage on the plateform after 2015. The current usage metrics is available 48-96 hours after online publication and is updated daily on week days.
Initial download of the metrics may take a while.