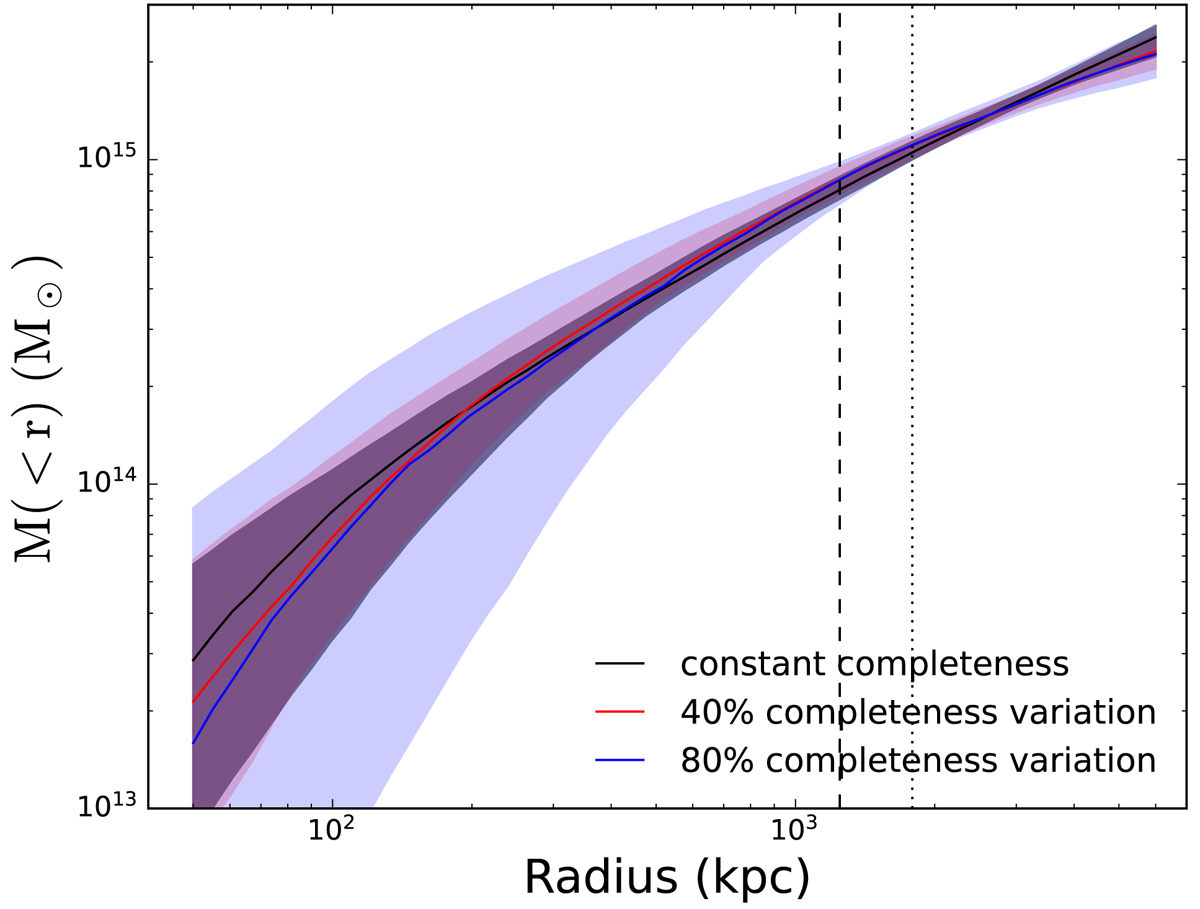
Fig. A.1.
Download original image
Mass profiles of A2029 with radially varying completeness. The black line assumes the completeness is a constant with radius. The red and blue lines assume the completeness decreases from the innermost region to the ourtermost region by 40% and 80%, respectively. Shadow regions present the 1 σ credible intervals. Larger completeness variations show larger uncertainties due to the smaller sample after reducing the effective number of galaxies at small radii. The vertical dashed and dotted lines mark the positions of r500 and Rhalf, respectively. The variations of the mass profiles due to different completeness functions are well with the 1 σ region, suggesting our results are not sensitive to incompleteness.
Current usage metrics show cumulative count of Article Views (full-text article views including HTML views, PDF and ePub downloads, according to the available data) and Abstracts Views on Vision4Press platform.
Data correspond to usage on the plateform after 2015. The current usage metrics is available 48-96 hours after online publication and is updated daily on week days.
Initial download of the metrics may take a while.