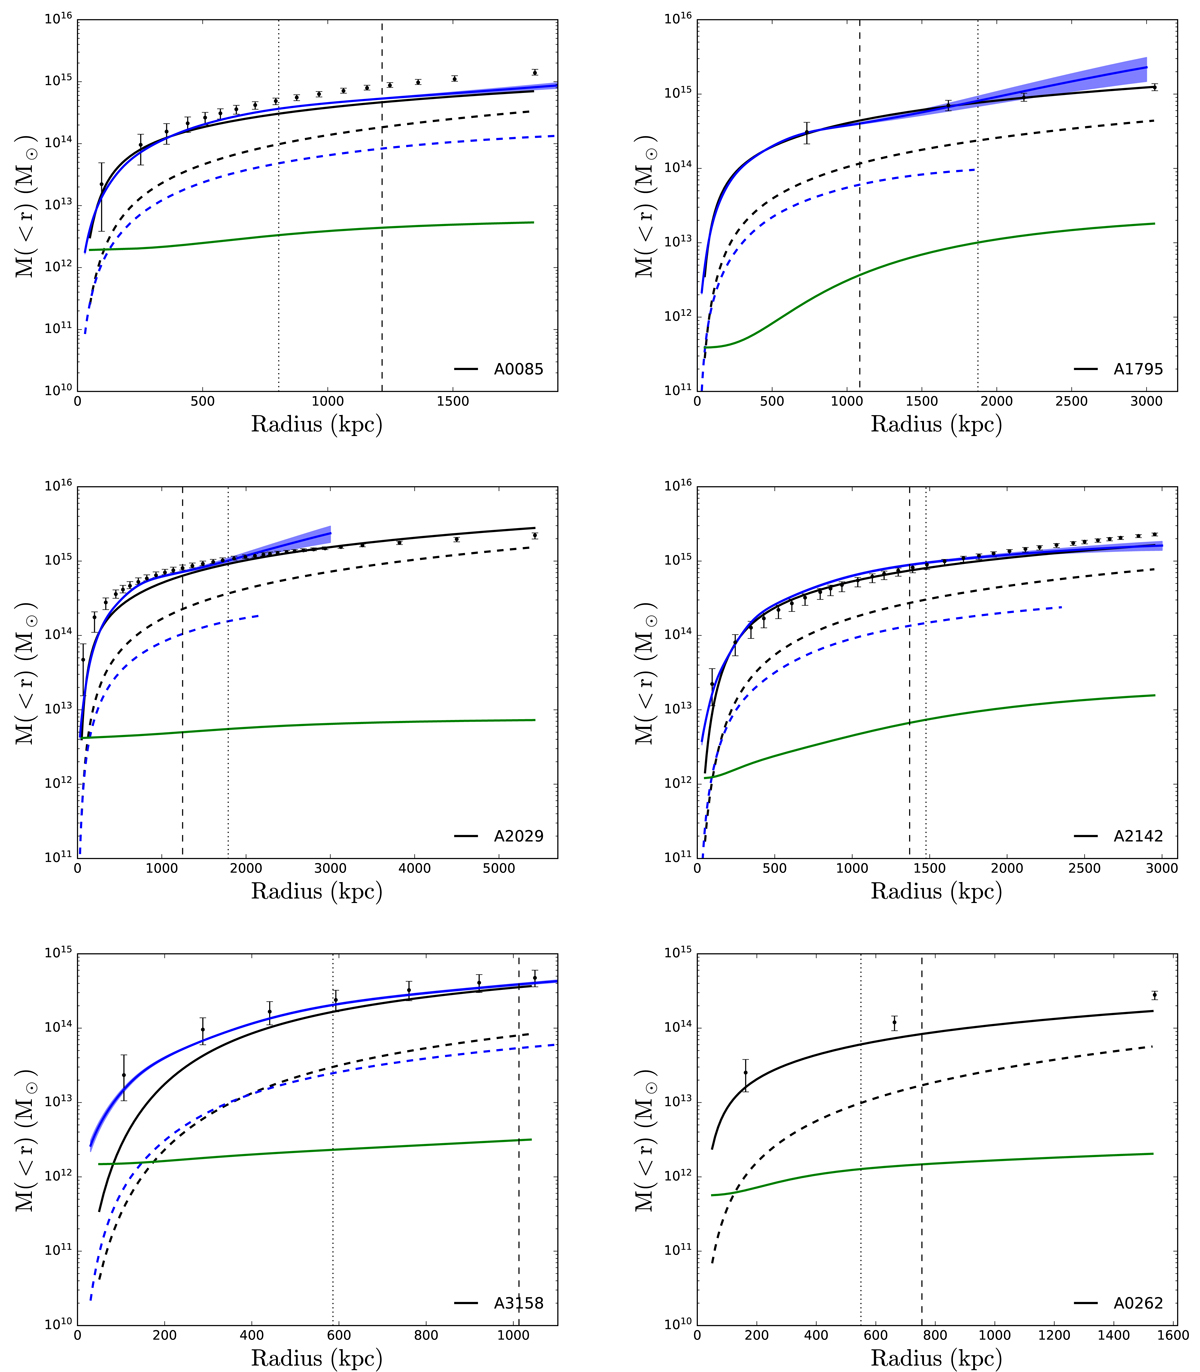
Fig. 3.

Download original image
Mass profiles of undisturbed clusters of galaxies. Points with error bars are the total mass profiles from velocity dispersion. Solid and dashed blue lines are the hydrostatic mass and gas mass profiles from the X-COP project, respectively, while solid and dashed black lines show the corresponding results from the surface brightness fits using the β functions in Chen et al. (2007). Green lines show the stellar mass distributions. Vertical dashed lines indicate the positions of r500 measured by Zhang et al. (2011) with X-ray data, while dotted lines mark Rhalf, which equally divide the total cluster galaxies. For these undisturbed clusters, the dynamical mass profiles from galaxy kinematics are generally consistent with hydrostatic mass profiles, but they extend to larger radii in general. Possible reasons for the inconsistency in some clusters are discussed in the text.
Current usage metrics show cumulative count of Article Views (full-text article views including HTML views, PDF and ePub downloads, according to the available data) and Abstracts Views on Vision4Press platform.
Data correspond to usage on the plateform after 2015. The current usage metrics is available 48-96 hours after online publication and is updated daily on week days.
Initial download of the metrics may take a while.


