Fig. 2.
Download original image
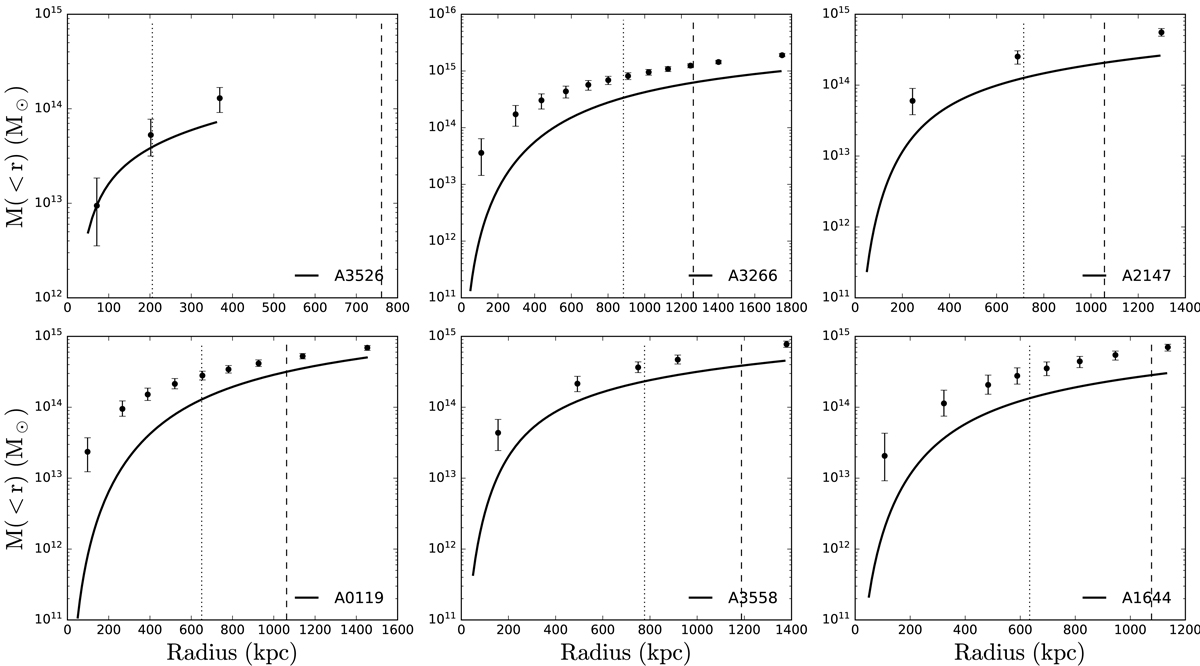
Dynamical mass profiles of six disturbed clusters of galaxies. Solid lines are the hydrostatic mass profiles derived from the surface brightness fits using the β function from Chen et al. (2007). Points with the error bar show the total mass profiles from the line-of-sight velocity dispersion. Vertical dashed lines indicate the positions of r500 measured from X-ray data by Zhang et al. (2011), while dotted lines mark Rhalf enclosing 50% of the total cluster galaxies. 3D radii are chosen according to the binned projected radii to avoid oversampling. That the dynamical mass profiles determined from different tracers are inconsistent presumably indicates nonequilibrium conditions stemming from recent or ongoing mergers.
Current usage metrics show cumulative count of Article Views (full-text article views including HTML views, PDF and ePub downloads, according to the available data) and Abstracts Views on Vision4Press platform.
Data correspond to usage on the plateform after 2015. The current usage metrics is available 48-96 hours after online publication and is updated daily on week days.
Initial download of the metrics may take a while.