| Issue |
A&A
Volume 677, September 2023
|
|
|---|---|---|
| Article Number | A48 | |
| Number of page(s) | 16 | |
| Section | Planets and planetary systems | |
| DOI | https://doi.org/10.1051/0004-6361/202346417 | |
| Published online | 01 September 2023 | |
ExoplANNET: A deep learning algorithm to detect and identify planetary signals in radial velocity data
1
Gerencia de Tecnología de la información y de las Comunicaciones (GTIC), Subgerencia Vinculación y Desarrollo de Nuevas Tecnologías de la Información, DCAP-CNEA, Centro Atómico Constituyentes,
Av. Gral. Paz 1499,
1650
Buenos Aires, Argentina
e-mail: This email address is being protected from spambots. You need JavaScript enabled to view it.
2
International Center for Advanced Studies (ICAS) and ICIFI (CONICET), ECyT-UNSAM, Campus Miguelete,
25 de Mayo y Francia,
1650
Buenos Aires, Argentina
Received:
14
March
2023
Accepted:
30
June
2023
Abstract
The detection of exoplanets with the radial velocity (RV) method consists in detecting variations of the stellar velocity caused by an unseen substellar companion. Instrumental errors, irregular time sampling, and different noise sources originating in the intrinsic variability of the star can hinder interpretation of the data, and even lead to spurious detections. Machine learning algorithms are being increasingly employed in the field of extrasolar planets, some with results that exceed those obtained with traditional techniques in terms of precision. We seek to explore the scope of neural networks in conjunction with the RV method, in particular for exoplanet detection in the presence of correlated noise of stellar origin. In this work, a neural network is proposed to replace the computation of the significance of the signal detected with the RV method and to classify it as of planetary origin or not. The algorithm is trained using synthetic data for systems with and without planetary companions. We injected realistic correlated noise into the simulations based on previous studies of the behaviour of stellar activity. The performance of the network is compared to the traditional method based on null-hypothesis significance testing. The network achieves 28% fewer false positives. This improvement is observed mainly in the detection of small-amplitude signals associated with low-mass planets. In addition, its execution time is five orders of magnitude faster than the traditional method. The superior performance of our algorithm has only been showcased with simulated RV data so far. Although in principle it should be straightforward to adapt it for use in real time series, its performance remains to be thoroughly tested. Future work should allow us to evaluate its potential for adoption as a valuable tool for exoplanet detection.
Key words: methods: data analysis / techniques: radial velocities / planets and satellites: detection
© The Authors 2023
 Open Access article, published by EDP Sciences, under the terms of the Creative Commons Attribution License (https://creativecommons.org/licenses/by/4.0), which permits unrestricted use, distribution, and reproduction in any medium, provided the original work is properly cited.
This article is published in open access under the Subscribe to Open model. This email address is being protected from spambots. You need JavaScript enabled to view it. to support open access publication.
1 Introduction
The study of extrasolar planets is a relatively new field of research. Although the first evidence of the existence of this type of body was uncovered in 1917 (Landau 2017), it was not until the 1990s that the first confirmed detections were made. In 1992, by analysing variations in the period of the pulses received from the radio millisecond pulsar PSR1257+12, Wolszczan & Frail (1992) concluded that at least two Earth-mass planets are in orbit around the pulsar. Three years later, Mayor & Queloz (1995) discovered the first exoplanet orbiting a solar-type star, 51 Peg b, by measuring variations in the line-of-sight (radial) velocity of the host star induced by the unseen companion. In the years that followed this first detection, the radial velocity (RV) technique allowed a large number of planet candidates and information-rich systems to be unveiled, some with masses as small as a few times that of Earth (e.g. Lovis et al. 2006; Mayor et al. 2009; Wright et al. 2016; Anglada-Escudé et al. 2016; Astudillo-Defru et al. 2017a,b; Feng et al. 2017; Delisle et al. 2018; Bonfils et al. 2018; Díaz et al. 2019; Zechmeister et al. 2019; Dreizler et al. 2020), and also revealed some promising candidates for future atmospheric characterisation (e.g. Bonfils et al. 2018; Díaz et al. 2019).
These discoveries were mostly made possible thanks to continuous improvement in instrumentation, which provides ever-increasing precision in the measurement of stellar RV. From the pioneering ELODIE spectrograph (Baranne et al. 1996), to the High Accuracy Radial velocity Planet Searcher (HARPS; Mayor et al. 2003), SOPHIE (Perruchot et al. 2008; Bouchy et al. 2013), and CARMENES (Quirrenbach et al. 2014), and finally to the ultrahigh-precision spectrographs such as ESPRESSO (Pepe et al. 2021) and EXPRES (Jurgenson et al. 2016; Blackman et al. 2020), precision has been improved by over two orders of magnitude, now attaining a level of 10 cm s−1.
However, planet detection with these observations is not only limited by instrumental precision but also by intrinsic variability in the star. Even for the least active, slowly rotating stars, certain phenomena – collectively called stellar activity – can produce spurious RV variations with amplitudes of up to a few meters per second and on timescales ranging from a few minutes (pulsations and granulation; e.g. Dumusque et al. 2011b) to decades (activity cycles; e.g. Lovis et al. 2011; Díaz et al. 2016). Particularly worrying are the variations produced by the rotational modulation of the star, as they tend to exhibit power in the same frequency range as some of the most interesting planetary candidates (e.g. Saar & Donahue 1997; Boisse et al. 2009; Dumusque et al. 2011a; Nielsen et al. 2013). The main consequence of the influence of stellar activity is the difficulty to detect exoplanets producing RV variations of smaller than 1 m s−1. Some of the most relevant stellar phenomena that can generate this type of noise are as follows:
Stellar oscillation: Pressure waves (p-modes) propagate at the surface of solar-type stars causing contraction and expansion of the outer layers over timescales of a few minutes (5–15 min for the Sun, Broomhall et al. 2009; Schrijver & Zwaan 2000). The radial-velocity signature of these modes typically varies between 10 and 400 cm s−1, depending on the star type and evolutionary stage (Schrijver & Zwaan 2000).
Granulation: Various convective motions in the photosphere cause this phenomenon. These ‘granules’, which emerge from the interior of the star into the photosphere, are hotter than those that cool down and descend. This produces a spurious red-shift (Lefebvre et al. 2008; Dumusque et al. 2011b) that changes depending on the convection pattern and can range from a few minutes to about 48 h.
Rotational modulation: The rotation of the star can transport various structures on the surface, causing them to appear and disappear at regular intervals, breaking the flux balance between the redshifted and blueshifted halves of the star and creating the illusion of stellar wobble (Saar & Donahue 1997; Meunier et al. 2010; Dumusque et al. 2011a).
From a statistical standpoint, one of the main issues is that these phenomena produce correlated error terms that invalidate some of the most commonly used techniques for planet detection, which rely on ordinary least squares, such as the standard periodogram analyses (Baluev 2008; Zechmeister & Kürster 2009). This problem has often been approached by including correlated noise errors in the modelling of the data. In particular, Gaussian process regression (Rasmussen & Williams 2005) has been widely adopted by the community (e.g. Haywood et al. 2014; Rajpaul et al. 2015; Yu et al. 2017; Cloutier et al. 2017; Persson et al. 2018; Bonfils et al. 2018; Díaz et al. 2019; Luque et al. 2019; Suárez Mascareño et al. 2020, just to cite a few among a vast body of literature using this technique), fuelled by the availability of specific computer code to perform the necessary calculations effectively (Foreman-Mackey et al. 2017; Espinoza et al. 2019; Delisle et al. 2022). However, methods to compare models including this kind of error term can be time-consuming or unreliable (Nelson et al. 2020).
A different approach is to bypass the problem of explicitly modelling the effects of activity together and to rely instead on machine learning models to perform the detection and classification tasks. This has been used mostly for the detection and veto of transiting planet candidates with photometric time series (e.g. Zucker & Giryes 2018), mainly from the space missions Kepler (e.g. Armstrong et al. 2017; Shallue & Vanderburg 2018; Pearson et al. 2018; Ansdell et al. 2018), K2 (e.g. Dattilo et al. 2019), and TESS (e.g. Yu et al. 2019; Osborn et al. 2020; Rao et al. 2021), but also from ground-based transit surveys such as the Next Generation Transit Survey (e.g. McCauliff et al. 2015; Armstrong et al. 2018). These models mostly rely on deep con-volutional networks (e.g. Lecun et al. 1998), which have proven extremely proficient in many fields, mainly computer vision (e.g. Krizhevsky et al. 2012; He et al. 2016) and natural language processing (e.g. Peters et al. 2018; Devlin et al. 2019). It is not a surprise that these methods have been advanced mostly for spaced-based photometric surveys, as these missions provide rich datasets that are needed to train these kinds of machine learning models. But machine learning has also been employed in the context of exoplanets in order to study their atmospheres (e.g. Márquez-Neila et al. 2018; Waldmann 2016), or to classify planets according to their potential habitability (e.g. Saha et al. 2018). Recently, de Beurs et al. (2020) used neural networks to remove the stellar activity signal from simulated and real RV observations and showed how this can help in exoplanet detection.
In the present article, we show how we trained a convolutional neural network (CNN) with simulated data to perform the detection of extrasolar planets in RV time series. We frame the question as a classification problem and trained the model to distinguish periodograms with and without planetary signals. We show that, as well as being much faster, this method produces better results than the traditional periodogram analyses and correctly identifies more low-mass planets.
2 Planet detection with GLS periodograms
The RV method consists in detecting variations in the line-of-sight projection of the velocity of a star induced by the presence of an unseen companion.
2.1 Periodograms
Periodograms are often employed to find periodic signals in unevenly sampled time series, such as those typically obtained in RV surveys. The Lomb–Scargle periodogram (Zechmeister & Kürster 2009; Khan et al. 2017) has been used extensively to detect periodic signals in RV datasets. In its simplest form, it works in a Fourier-like fashion: the user defines a series of candidate frequencies {ωi}, with i = 1,…, Nf, and the method fits the RV data, υ(t), using a sine-cosine base at the candidate frequency. The better the model fits the data at this frequency (compared to a constant model without variability), the higher the power attributed to the candidate frequency (for details, see Lomb 1976; Scargle 1982; Baluev 2008). Indeed, the power at frequency ωi is:
 (1)
(1)
where  is the chi-square statistics for the model at frequency wi. If we use fi (t) to denote the model prediction at time t:
 (2)
(2)
where the sum runs over the N data points in the time series.
A vector is generated with the power of each candidate frequency. The location of the highest power indicates the frequency of a potential periodicity present in the data. Figure 1 shows a time series (with a clear periodic signal) and the resulting periodogram. We note that the width of the peaks expressed in frequency depends solely on the time span of the observations ΔT, and can be expressed as:
 (3)
(3)
2.2 False alarm probability
Once the periodogram has been constructed, and a candidate period is identified, a tool is needed to help decide whether the observed peak is sufficiently statistically significant to be considered a periodic signal. This question is traditionally framed as a null-hypothesis significance test, in which the null hypothesis H0 that there is no planet is tested. More precisely, in the analysis of the Lomb–Scargle periodograms, the null hypothesis is often that the observations come from uncorrelated Gaussian noise (i.e. there is no planet). The power of the largest peak is used as the test statistics, for which a p-value is computed1. If the p-value is small enough, then the null hypothesis is rejected. The critical value below which a p-value is considered as evidence for rejecting the null hypothesis is usually between 10−3 and 0.1. In many planet search programmes, a false-alarm probability (FAP) value of 0.01 is often used as a threshold below which detected peaks are considered significant (e.g. Howard et al. 2010; Bonfils et al. 2013). Based on these previous studies, the critical value – which we call FAP* – will be taken as 0.05 with log10(FAP*) rounded to −1.3.
To compute the p-value (FAP) one can take an analytical or numerical approach, using a Monte Carlo algorithm. The analytical expressions (e.g. Scargle 1982; Baluev 2008; Vander Plas 2018) have the advantage of being much faster to compute than Monte Carlo approaches. However, these expressions rely on assumptions and approximations that are only reliable in certain regimes. For example, they often rely on the assumption that the errors are uncorrelated and normally distributed. Following the comments in Baluev (2008), we considered that, if the p-value is greater than or equal to log10 (0.01), the analytical expression is no longer reliable and the other method should be preferred. On the other hand, the Monte Carlo approach samples the data points while keeping the observing times and is therefore probably more reliable even for situations where the assumptions on which analytical expressions are based do not hold. In this work, a number of noise realizations are sampled to compute the p-value of the largest peak power with this approach. As we work with simulations, the correct noise distribution is used. This is the most favourable situation, but is rarely, if ever, given with real datasets. The Monte Carlo approach requires hundreds or thousands of periodograms to be recomputed, which makes it a much slower method than the analytical approach, especially when taking into account that we want to analyse a large number of time series.
As in any null-hypothesis significance test, we are exposed to type I and II errors (e.g. Frodesen et al. 1979). Type I, or ‘false alarm errors’, occur when H0 is incorrectly rejected (i.e. we decided a peak is significant when it is not). Type II errors are when we fail to reject H0 when in reality a planet is present.
These errors are also often referred to as false positives and false negatives.
When using this approach, one still needs to decide whether the detected signal is of planetary origin or caused by activity or systematic effects. Often, time series of activity indexes are employed to verify that the candidate frequency is not present in these series, which is regarded as evidence for the planetary interpretation of the signal. However, there is not a universally accepted way to decide whether or not a signal is produced by a planet.
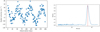 |
Fig. 1 RV measurements (left) and their periodogram (right), the red line marks the peak that represents the period with the highest power. |
3 Simulations
A dataset of sufficient size is required to train, validate, and test the network. In principle, it is not known how large this dataset needs to be, but the larger the set with which the network is trained and validated, the better the results are expected to be (see Banko & Brill 2001 for a famous example, and the discussion by Halevy et al. 2009).
The dataset not only needs to be large but also representative – that is, in terms of the number of points, variability, presence of periodic signals, and so on – of the cases that the network will encounter when used in the ‘production stage’, that is, when used to classify actual time series. The available RV time series issued from large-scale surveys are too few and too diverse for an efficient training. They do not have enough representatives of each type of variability and planetary system architecture. In addition, without knowing the precise number of planets in the system means we would also have to deal with the problem of inaccurate labelling, that is, not being able to precisely convey to the algorithm the class to which a given dataset belongs.
The alternative is to train and evaluate the network on synthetic RV time series, and to later study its performance on real datasets. If the simulated data are sufficiently realistic, this may be enough, but most probably, an adaptation of the network architecture would be needed. Artificial data have many obvious advantages: being able to produce a large number of time series, and to know the precise number of periodic signals in them is fundamental. On the other hand, one clear disadvantage is that the relevance of the results from our study, at least in principle, is directly dependent on how realistic our simulations are.
Our network takes periodograms as inputs. We proceed by first generating synthetic time series, from which the generalised least-squared (GLS; Zechmeister & Kürster 2009) periodogram is produced. The reason for this is that while we have relatively good models with which to simulate time series, the problem of directly simulating periodograms is much tougher. The steps of the simulation process are detailed in the subsections below.
3.1 Time array
The synthetic time series are sampled using 200 quasi-uniformly distributed points. The times are defined by adding random variables drawn from a zero-centred normal distribution with a width of 0.1 to an evenly spaced time array. Although not completely realistic, this sampling roughly represents an intensive observing season with nightly observations on each target2.
3.2 Intrinsic errors
Intrinsic error terms3 are simulated by randomly drawing samples from an uncorrelated multivariate zero-centred normal distribution, with variances informed by the statistics of the uncertainties of the HARPS high-precision survey (e.g. Udry et al. 2019; Díaz et al. 2016). For each simulated star, a star is randomly drawn from the subset of HARPS targets that were observed more than 40 times by the survey. Using the observations of this star, the mean velocity uncertainty,  , is computed. Then, 200 samples are drawn from a normal distribution centred on
  and with a width of 0.30 m s−1, which is a typical value for the dispersion in the velocity uncertainties of observed stars. Negative values are replaced by
  . In this way, each data point has a slightly different uncertainty and error term, as is usually the case in real time series.
3.3 Activity signals
Above, we mention that there are several components of stellar noise that can alter RV measurements. Simulated effects of pulsations and granulations were based on the work by Dumusque et al. (2011b). These authors studied the power spectrum of five well-observed solar stars, fitting the spectrum with a Lorentzian component that represents the pulsations and three components for the granulation, mesogranulation, and supergranulation. Using the fitted parameters defined therein, the power spectrum is constructed as the sum of these four components, with randomly chosen phases for each component. The resulting power spectrum is used to generate the synthetic RV measurements.
The effect of the rotational modulation was simulated using samples from a Gaussian process with a covariance function generated with the pseudo periodic kernel:
 (4)
(4)
This kernel is used widely in the exoplanet literature to model this kind of effect4 and has been used to infer the rotational period and other parameters of astrophysical interest related to stellar activity and rotation (e.g. Giles et al. 2017; Angus et al. 2018): This kernel has four hyperparameters: A, the covariance amplitude; 𝒫, the recurrence time, which would be given by the rotation period; τ, the decay time, associated with the average lifetime of an active region; ϵ, the structure factor, a parameter associated with the number of active regions that occur simultaneously.
To define the values of these hyperparameters for each simulated time series, we resorted again to the HARPS survey. All stars in the survey have an estimate of their rotation period obtained from a measurement of their magnetic activity using the calibration by Mamajek & Hillenbrand (2008). For each simulated velocity series, the value of 𝒫 was randomly chosen from the sample of estimated rotational periods for HARPS stars. The remaining parameter values were sampled from distributions:
A ~ gamma distribution, Γ(2.0 , 0.5).
τ ~ normal distribution, 𝒩(3 * 𝒫 , 0.1*𝒫).
ϵ ~ uniform distribution, 𝒰(0.5 , 1.0).
Adding the intrinsic errors to the activity signals makes the time series of RVs without a planet rυwp.
3.4 Planets
The contribution of planets to the velocity time series is generated assuming circular orbits. Additionally, we disregard mutual interaction in multi-planetary systems.
Therefore, we need three parameters: the orbital period, Ppl, the semi-amplitude of the variation K, and the time in which the variation is zero, T0. The value of Ppl was chosen randomly between 10 * δ and Δt/2, where δ is the minimum distance between two points in the time series, and Δt is the total duration of the series. The value of K was drawn from a loguniform distribution between 0.1 m s−1 and 10 m s−1. Finally, T0 was randomly chosen as a moment within an orbital period.
The variation then takes the form:
 (5)
(5)
Once the vector rυpl has been obtained, it is added directly to rυwp to get the time series for the planet (see Fig. 2). In line with our decision to neglect mutual interactions, to model multi-planetary systems, the procedure is repeated for each planet and the contributions were added.
3.5 Periodograms
GLS periodograms were computed for each simulated time series on a grid of uniformly sampled orbital frequencies between δv and 0.5 day−1 with a constant step of δv/10 (i.e. using an oversampling factor of 10), where δv is the inverse of the duration of the time series:
 (6)
(6)
3.6 Datasets
To train, validate, and test the neural network, several datasets are needed to guarantee the robustness of the proposed solution and the quality of the results. The usual methodology when working with periodograms is to analyse the maximum peak and to decipher whether or not it comes from a significant signal. If so, the signal is removed from the original time series, and a new periodogram is generated using the model residuals, where a new maximum peak is identified and analysed in a similar fashion. This means that the network will not only receive the original periodogram as input, but also subsequent periodograms obtained in this manner. Therefore, in addition to simulating periodograms of stars with up to four planets, we also constructed additional periodograms by removing the signal at the largest peak frequency (regardless of whether it was significant or not). This process was performed four times for each original signal. This not only serves to have more varied periodograms but also increases the size of the training data.
This particular type of problem – where an input is considered and has to be assigned to one of two classes (here, planet or not planet) – is called a binary classification problem. In this type of problem, it is very important to consider the balance of the classes in the dataset – that is, the fraction of instances from each case – and the metrics used during training. For example, if an algorithm is trained with many more cases of a given class, it may be biased against predicting the minority class. This may lead to a model with relatively good accuracy (i.e. the fraction of cases correctly classified) that is ultimately useless.
This was considered when constructing the training, validation, and test sets. The first two were for training and parameter adjustment, and the final one was for testing the complete method. For all the sets, the same number of stars with 0, 1, 2, 3, and 4 planets was generated and all their periodograms, constructed as described above, were used for parameter tuning and testing. Due to the nature of the generation process, these sets are naturally unbalanced towards negative cases. Consider that from each system, four periodograms are generated independently of the number of planetary signals injected. Therefore, for each star without planets, for example, four periodograms with negative labels will be produced. In addition, for systems with planets, the planetary frequency may not be at the maximum peak, which would lead to another negative label, even in the presence of a planet in the simulation. This was not considered a problem for datasets used for evaluation because they are seen as a realistic application. However, for the training set, a balanced dataset is more important, and therefore periodograms were randomly selected to have near half positive and half negative cases.
In summary, three datasets were generated. In all cases, we simulated an equal number of stars with 0, 1, 2, 3, and 4 planets.
Set 1 – 3425 stars: From this set, 13 700 periodograms were generated with the process described above. This set was balanced by randomly selecting positive and negative cases until 40% of positive cases was reached. This set was used for training and validation (see Sect. 4).
Set 2 – 2550 stars: From this set, we get 10000 periodograms. This set was used for comparisons between methods and a threshold search (see Sects. 5.1 and 5.2).
Set 3 – 5000 stars: This set leads to 20 000 periodograms and was used to apply the Virtual Astronomer to each star and to analyse the distribution of output values for the FAP and the CNN (see Sects. 5.3 and 5.5).
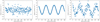 |
Fig. 2 Stellar noise (left), the planetary signal with a period of 62 days and an amplitude of 10 m s−1 (centre), and the resulting composition (right). |
4 Convolutional neural network
The neural network (nicknamed ExoplANNET) was implemented using the Keras package for Python, with Tensorflow as backend. It receives one GLS periodogram, represented in a one-dimensional array of data, together with two additional characteristics: the power and position of the largest peak in the 1D array. The input GLS periodogram was sampled in a grid of 990 frequencies. The frequency grid was fixed and was the same for all simulated velocity datasets. The output is a single value representing the probability that the data were originally created from a periodic signal (in addition to the activity signals).
A natural solution in this setting is to use convolutional networks in one dimension5. The architecture is quite standard. The hidden layers will be composed of convolutional layers, interleaved with max pooling layers. Finally, a series of dense layers are implemented, interspersed in turn with dropout layers. All layers use ReLU activation functions; except the output neuron, which uses a sigmoid activation function for classification that returns a real value of between 0 and 1.
The network is trained using the cross-entropy loss function,
![Mathematical equation: $E = \sum\limits_{i = 1}^N {\left[ {{t_i}\log \left( {{p_i}} \right) + \left( {1 - {t_i}} \right)\log \left( {1 - {p_i}} \right)} \right]} ,$](/articles/aa/full_html/2023/09/aa46417-23/aa46417-23-eq11.png) (7)
(7)
where the sum is over all the instances (of a batch) of the dataset, pi is the predicted probability of belonging to the positive class, and ti is the target variable (1 if the data contain a periodic signal; 0 otherwise). In each training epoch, the dataset is divided into batches of 128 periodograms, and the weights (parameters) of the model are adjusted using the Adam optimiser, with gradients computed based on the partial loss function. This is standard procedure in machine learning literature and has been shown to increase the performance and convergence of the optimisation process (see e.g. Bishop 2007).
The evolution of the training was monitored using the F-measure (or F-score), which is the harmonic mean of precision (P) and recall (R), F1 = 2(PR)/(P + R). In turn, precision and recall are defined as follows:
– Precision is the ratio of true positive cases among those that were marked as positive. In our case it would be:
 (8)
(8)
– Recall is the ratio of true positive cases detected among the positive existing ones.
 (9)
(9)
Unlike the accuracy, the F-score is appropriate even in unbalanced cases.
Different network configurations were tested and evaluated with the validation set. The final architecture achieved an F-score of 0.88 in the validation set. A diagram of the retained architecture is shown in Fig. 3. The trained network is provided in h5 format in a Git Hub repository6, together with a sample of labelled periodograms for testing.
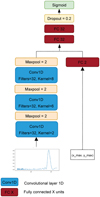 |
Fig. 3 Architecture of the ExoplANNET neural network. Blue cells represent convolutional layers; pale orange cells are max pooling layers and dark red cells are fully connected layers. In addition, we show the single dropout layer in yellow and the output layer in green. |
5 Results
5.1 Predictive performance
For a given periodogram, both the classical FAP computation and our CNN output a number. In the former, this number is the log probability that a peak with at least as much power as the largest peak observed in the periodogram appears under the null hypothesis (i.e. only noise – albeit correlated – is present in the time series). In the latter, it is a value between 0 and 1 that can be interpreted as the probability that the periodogram contains a bona fide planetary signal. Both implementations require the definition of a threshold value if they are to be used for making decisions, such as defining whether or not a planet is present in the data. However, we note that the FAP method is only intended to assess the significance of a signal, while the neural network is also designed to provide a classification of the nature of the signal.
Before setting this threshold, an analysis of the overall effectiveness of each method can be made and these can be compared using precision–recall (PR) curves. From the definitions seen in the previous section, it is trivial to see that both metrics vary between 0 and 1 and maximizing precision minimize the false positives and recall does so with false negatives.
The PR curve (Fig. 4) shows the trade-off between these metrics. These curves are constructed by varying the threshold for detection and computing the metrics at each value. Ideally, the curves should pass as close as possible to the upper right edge of the plot, which represents a system with perfect recall and no false positives. Therefore, the greater the area under this curve, the better the overall performance of the algorithm. The area under the curve of the PR curve (PR-AUC) is useful for comparing two different solutions to the same problem.
In Fig. 4, we present the PR curve and PR–AUC metric for the classical FAP method over the periodograms of set 2. We see that the network performs systematically better than the traditional method. The AUC metrics are 0.90 and 0.96 for the FAP and ExoplANNET methods, respectively.
In Fig. 5, we present the distribution of the output values (i.e. FAP values and planet probability) for the periodograms of set 2. As expected, periodograms for which the methods assign a probability close to 1 are predominately originated by real planets. Inversely, outputs very close to zero are mostly associated with periodograms containing no planets. On the other hand, the value of the x-axis where both histograms cross is much larger for the FAP method.
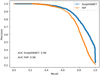 |
Fig. 4 Precision-recall curve and AUC of both methods over the periodograms of set 2. |
5.2 Defining the threshold for planet detection
Once the general performance has been analysed, we now turn to the topic of finding an adequate threshold for the neural network model. As already mentioned, we considered a log threshold of −1.3, that is, a 0.05 probability for the FAP. The number of false positives and false negatives produced by the FAP method using this threshold was computed and used to find the range of probability thresholds for the network that gives smaller numbers of both false positives and false negatives.
In Fig. 6, the numbers of false positives and false negatives are shown as a function of the threshold used for the network.
The values produced by the FAP method are marked as horizontal dashed lines. This defines a range between 0.69 and 0.77 within which the network obtains better results than the FAP. Any threshold value greater than 0.69 will give fewer false positives, and those smaller than 0.77 will give fewer false negatives. The network threshold was then set to 0.77 in order to produce the most reliable detection mechanism in terms of false positives, with a similar recall to the traditional method.
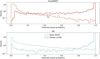 |
Fig. 5 Distribution of output values over the periodograms of set 2 (probabilities and FAP values for the CNN and classical analysis, respectively). For each algorithm, the distribution of data labelled as planets and as noise is shown with different line styles. As there are 15 587 periodograms without planets for the 4413 planetary periodograms, the distributions are normalised for easier comparison. |
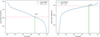 |
Fig. 6 False positives (left) and false negatives (right) as a function of the threshold showing the lower and upper limit of the threshold where the network has both fewer false positives and fewer false negatives than the traditional method. The dashed horizontal lines show the number of incorrect detections with the FAP method, and the vertical segment aids in the identification of the corresponding probability threshold. |
5.3 Performance on test set
The last performance evaluation was conducted on set 3. As set 2 was used to identify the threshold range where the network performs better than the traditional method, there is a concern that the choice of the threshold may have been influenced by the characteristics of this particular set, leading to overfitting. To address this, we evaluated the performance of the network on the yet-unseen set 3.
The confusion matrices for both methods are shown in Table 1. The rows show the true labels of positive and negative cases in the set and the columns show the predicted label.
The results obtained in this evaluation are consistent with those from set 2. Compared to the traditional method, the number of false positives decreased by 28.5%, while only two additional false negatives were identified. This is reflected in the comparison in Table 2, where the recall remains almost unchanged but the precision is increased.
Confusion matrices ExoplANNET and FAP.
ExoplANNET and FAP precision and recall.
5.4 Execution time
It is shown in Sect. 1 that, depending on the result, the calculation of the FAP can be done using the Baluev formula or a Monte Carlo-type algorithm. The analytical formula is not very computationally expensive but assumes white noise. On the other hand, running the Monte Carlo computation on a large dataset of RVs and computing their corresponding periodograms can take up considerable time, especially when red noise has to be simulated. All this means that the average time required to calculate a FAP value can be considerable.
The case of the network is quite different. A trained network is nothing more than a large matrix and making a prediction is simply taking the input and executing basic operations such as addition and multiplication to return a value. Because of this simple fact, the network should be much faster7.
To compare the execution times between the methods, we need to consider the Wall-Time and the Proc-Time. The latter is the time used exclusively to execute a process. It does not take into account disk access or other input and output operations, operating system interruptions, time used in other processes, and so on. In contrast, Wall-Time is the clock time it takes to execute something. It is simply a stopwatch, and so if the process is waiting to read data or the system is very busy with several processes, it will add to this time.
On the other hand, if you want to evaluate the time of small programs or pieces of code, it is usually convenient to see only the Proc-time. The code for generating the periodograms is not parallel (at least not in its current implementation), and so these two times should be very similar.
The methods were executed several times, and the resulting running times were averaged. For the FAP method, we perform 100 executions (we note that if the result of the Baluev formula is sufficiently good, the Monte Carlo simulations are not necessary). For the network method, we generated predictions for 106 periodograms8. The results are presented in Table 3 where we report the time taken to analyse a single periodogram, expressed in seconds.
The difference is considerable. Focusing only on Proc-time, the network is 125 791 times faster, which is a difference of five orders of magnitude. The execution time required to calculate the FAP can seem excessively long, but we remind the reader that the Monte Carlo simulations performed include red noise in an attempt to make the method as reliable as possible.
However, we note that the code to calculate the FAP is not optimised. The noise simulations and the computation of the periodograms severely affect performance. These parts of the computation could be optimised, and the Monte Carlo procedure could be parallelised. However, the reality is that the advantage conferred by the network is too great for any realistic optimisation to bring it even close to these results.
As we are dealing with a relatively small network model and a manageable dataset size, the use of a GPU is unnecessary. The training process required about 30 min using a processor-optimised version of Keras/TensorFlow. However, when experimenting with larger networks and periodograms, GPU boards would likely become advantageous.
Execution times in seconds for the analysis of a single periodogram with ExoplANNET and FAP methods.
5.5 Virtual Astronomer
Having compared the performance of ExoplANNET with the traditional method using the FAP, we now seek to compare the performances of the two implementations in a fully automated process of sequentially finding planets in a time series.
The procedure is often carried out as follows: when a significant peak is found (i.e. its log10(FAP) ≤ −1.3), a sinusoidal signal at that frequency is fit and removed from the data. A new periodogram is computed from the residuals, and the process is repeated until the largest peak in a periodogram is not deemed significant. The pseudocode for this procedure – called Virtual Astronomer – is shown in Algorithm 1. This procedure is often the first step in analysing a RV time series, although there are much more sophisticated techniques to evaluate the significance of a signal in a dataset (e.g. Díaz et al. 2016).
The tests presented so far were performed on individual periodograms, which may have contained any number of simulated planets between zero and four; we have not yet demonstrated
the behaviour of the methods when used as part of the Virtual Astronomer. To this end, we performed an analysis using the threshold values determined in the previous section. Both implementations of the Virtual Astronomer, one using the classical FAP computation and another using the CNN predictions, were applied to each of the 5000 stars in the third dataset. The aim is to test how many planets the methods actually find in a complete, more realistic use case. In particular, we are interested in exploring their behaviour with respect to false positives.
While it is clear from the above analysis that ExoplANNET performs better in terms of false positives, it is not so clear that this would also be the case when using it with the Virtual Astronomer. On the one hand, the Virtual Astronomer with the FAP method labels more noise peaks as planets, which means that on average the execution will proceed over more iterations than the implementation using ExoplANNET. This may increase the chances that, in those additional iterations, the method detects planets that ExoplANNET could not find because it was better at identifying the first dominant non-planetary peak, which stopped the algorithm. On the other hand, this could also mean more false positives are identified with the FAP method.
To evaluate the performance of the Virtual Astronomer using each detection method, the numbers of false negatives and false positives were compared. In Fig. 7, we compare the performances as a function of the actual number of planets in the simulated system. The Virtual Astronomer using ExoplANNET yields a lower number of false positives than the implementation with the FAP method. Additionally, the number remains approximately constant over systems with different numbers of planets (Fig. 7). On the other hand, the FAP returns different numbers of false positives and false negatives depending on the number of planets in the system.
To further evaluate both implementations, the numbers of detected planets were compared to the maximum possible number under flawless decision making; that is, the maximum number of planets that could be found by the Virtual Astronomer if it had access to the real labels of the peaks. Remember that the fact that a star has N planets does not mean that all those planets will be reached by the Virtual Astronomer. If at a given step the peak corresponding to the planet is not the largest peak in the periodogram, the Virtual Astronomer will fail to identify it, and the process will stop. The results are shown in Fig. 8.
As shown by Fig. 8, the Virtual Astronomer using the FAP method allows more planets in the system to be detected. However, these extra planets come at the price of a larger number of false positives (Fig. 7). Similarly, the Virtual Astronomer using the FAP method exhibits systematically fewer false negatives, but only by a very small amount. Also, with the exception of the data with four planets, the FAP method also leads to fewer missed planets, that is, planets that are not even evaluated by the method.
This was expected because of the larger number of iterations brought forth by a larger false-positive rate. Overall, the FAP method is more inclined to produce a positive classification, which brings more planets but also more false positives.
Finally, to provide a global view, we computed the accuracy and completeness metrics of each implementation (see Table 4). Despite the difference in the number of periodogram evaluations with each implementation, the precision and completeness values maintain the relationship they had when they were based on single periodogram evaluations. Globally, the completeness is almost the same but the implementation with ExoplANNET increases the precision of the results, significantly reducing the number of false positives.
Virtual Astronomer
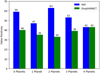 |
Fig. 7 False positives of the Virtual Astronomer with both implementations. |
Precision and recall of the Virtual Astronomer using the classical FAP method and ExoplANNET to decide on the nature of periodogram peaks.
6 Discussion
Having analysed the general behaviour of the FAP and ExoplANNET as methods for identifying bona fide planets in the presence of correlated noise, we now turn to an exploration of the dependence of the performance of the methods on planetary parameters. Figure 9 shows the precision and recall metrics as a function of the periods of the signals identified as planets, binned every five days. Both methods lose precision in the period range between 30 and 60 days. But while the precision of the FAP method drops below 0.75, the precision of ExoplANNET predictions stays above 0.85. On the other hand, the FAP shows a relatively constant recall across orbital periods, while the network exhibits a clear decrease at around the same period range.
This period range is associated with stellar rotation, and therefore many false positive signals are expected to appear here. Our interpretation is that ExoplANNET learns to be more ‘cautious’ when labelling peaks appearing in this range, which incidentally is the same way a professional astronomer usually behaves. As a consequence, the recall is degraded but the precision is kept relatively high. The FAP, on the other hand, does not exhibit any dependence in recall with orbital period and is therefore labelling more noise peaks as planets. As a consequence, the precision is degraded even more than for the network.
Figure 10 shows precision and recall as a function of the periodogram peak powers, binned every ten units of relative power. Although the curves for both methods are similar, ExoplANNET is more precise for low-power peaks. This leads us to the hypothesis that the network must be considering characteristics of the periodogram other than the maximum peak power, which allows it to better identify the relatively faint planetary peaks. It is in this range where the network produces less false detection than the FAP method, which explains the results of the previous sections.
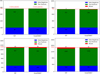 |
Fig. 8 Detections of both implementations of the Virtual Astronomer compared to the detections provided by a hypothetical optimal method with flawless decision making (see text for details). Each panel corresponds to 1000 systems with a given number of companions (upper left: 1000 stars with one planet; upper right: 1000 stars with two planets; lower left: 1000 stars with three planets; and lower right: 1000 stars with four planets). The number of planets detected by the flawless decision-making method is marked by dashed horizontal lines and indicated in red on the vertical axes. The bars present the true positives (i.e. detected planets; green), false negatives (blue), and the planets that were not detected (i.e. their peak was not evaluated; red). We note that even using the perfect method, more than half of the planets are missed. We also note that for systems with one planet, both FAP and ExoplANNET produce more planetary classifications than the flawless method. |
6.1 Robustness against simulation parameters
We examined the robustness of the results presented in the previous sections as a function of the number of data points in the test time series. We also looked at the effects of the presence of gaps in the time series or of a less uniform time sampling.
To this end, we designed a set of three experiments in which the test time series were modified in different ways: (1) First, a number of points were removed randomly from the time series. This allowed us to test the change in the performance metric in response to a change in the number of points. (2) In a second test, a block of a number of observations was removed from a random position in the time series and the effects were monitored. (3) In a final test, we removed a number of points from the beginning and end of the time series. We experimented with removing different numbers of points (20, 40, and 60), where half the points were removed from each end of the time series, and evaluated the model on the modified test time series without retraining the algorithm. We measured the precision and recall in all cases. The results are reported in Table 5.
Overall, we see that the performance of the network is only degraded slightly when the sampling and the number of points of the test set are changed. Across all strategies, the precision decreases as more points are removed. Also, randomly removing points seems to affect precision less than removing them in blocks, which in turn has a smaller effect than the removal of points from the ends of the time series. This is reasonable, as strategies 1 and 2 mostly retain the time span of the observations, which is a key parameter in determining the shape of the peaks appearing in the periodogram, while datasets modified using strategy 3 will produce periodograms with peaks, which are somehow broader and may be hindering correct classification.
On the other hand, the trends of recall are inverted. As the number of removed points increases, the recall actually improves. This is likely caused by the fact that, with less points, a larger fraction of small-mass planets become undetectable – that is, cease producing the largest peak in the periodogram – compared to more massive ones. Because the network exhibits a better performance on larger planets, the reduced dataset leads to an increase in recall.
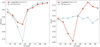 |
Fig. 9 Precision (left) and recall (right) as a function of the period of the detected planets, using the threshold (thr) 0.77 for the network and 0.95 for the FAP (see Sect. 5.2). |
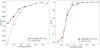 |
Fig. 10 Precision (left) and recall (right) as a function of the power in the periodogram of the detected planets, using the threshold (thr) 0.77 for the network and 0.95 for the FAP. |
Performance of ExoplANNET under different simulated time series sampling and number of points.
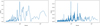 |
Fig. 11 Periodograms of HARPS data of HD40307. Left: trimmed to resemble the sampling of the training set as closely as possible. Right: using the full dataset. |
6.2 Recovery of a real signal
The network was trained on simulated data with particular characteristics of sampling, noise, and planetary signals. To test the ability of the network to recover real signals in actual datasets, we employed the HARPS dataset of HD 40307.
HD 40307 is known to host at least four low-mass planets (e.g. Mayor et al. 2009; Tuomi et al. 2013; Díaz et al. 2016) – one of which has an orbital period of 9.6 days – with periods that are well within the period range on which the network was trained. We employed the HARPS dataset from Díaz et al. (2016), which has 441 measurements taken over more than 10 yr.
We looked for a subset of the dataset with characteristics similar to those of the simulated sets and found a period of 190 days with 220 measurements between Julian dates 53692.7 and 53882.5. We constructed the periodogram for the data in this range of dates and computed a prediction using the network. The predicted probability for the peak at 9.6 days, the largest in the periodogram, is very close to 1 (see Fig. 11).
To see how this value varies under a different dataset for the same star, we recomputed the periodogram using the entire dataset. As shown in Fig. 11, the peaks become much narrower, as expected. The absolute peak power is also decreased in this dataset9. The network-predicted probability decreases to around 0.77, likely because of the differing peak width and power.
Unfortunately, the requirement of having datasets with around 200 measurements in a time window of around 200 days severely limits our ability to further test the method on real data. This would require a modification of the CNN architecture, which is outside the scope of this article.
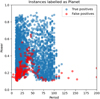 |
Fig. 12 Power and period of the largest peaks in the periodograms of set 3. The figure shows instances labelled by ExoplANNET as Planet, blue points indicate instances correctly classified, while red points show classification errors. |
6.3 Exploring the network caution around activity periods
As shown in Sect. 6, one of the differences between the procedure using ExoplANNET and the traditional method is that the network does not treat peaks at all frequencies in the same way. Indeed, the network exhibits a decrease in precision around the periodicity associated with activity signals, but this decrease is much smaller than that shown by the FAP method. This is compensated by a decrease in recall around these periods. In other words, the network seems to be more ‘cautious’ when judging a peak at the vicinity of the typical rotational period.
To explore this further, we studied the distribution of peak powers and periods for those instances labelled by the network as planets. In Fig. 12, we present this distribution. A wedge is clearly missing around the periods of the activity signals where the network requires, on average, a larger power to declare that a signal is a planet. However, we note that peak power is not the only criterion, as some instances with a much smaller power are correctly classified as planets.
Unfortunately, because of the way the dataset was constructed, we do not have access to the actual activity period injected for each case. Therefore, we cannot test whether the cautious range decided by the network depends on the actual activity period. Future work will focus on understanding this behaviour in much more detail. Additionally, the possibility of including activity proxies as features for the network may also help in recovering small signals even in the range of periods associated with stellar activity.
7 Conclusions
We implemented a CNN model (named ExoplANNET) to evaluate the presence of planetary signals in RV periodograms. The algorithm was trained on simulated data including red noise and various planetary companions. Its performance was evaluated using previously unseen data and compared with the traditional method based on null-hypothesis significance testing, that is, the FAP method.
Our method outperforms the FAP method on single periodograms, as evaluated by the precision-recall area-under-curve metrics. In other words, a threshold can be chosen so that the network produces a similar level of recall with about 30% fewer false positives. In addition, the network is at least five orders of magnitude faster than the traditional FAP method. However, we reiterate that in this work, the noise realisations used to compute the significance of observed peaks are performed using correlated noise, which is certainly slower than methods using only white noise; this process could be further optimised by using dedicated methods (e.g. Foreman-Mackey et al. 2017; Ambikasaran et al. 2015). Finally, ExoplANNET employs barely 1.7kB of computer memory. The trained network is provided in h5 format online10, together with a sample of labelled periodograms for testing.
The detection method was implemented within an iterative procedure to sequentially explore the presence of planetary signals in a RV dataset. This algorithm, called Virtual Astronomer, evaluates the maximum peak present in a given periodogram, and, if it decides it belongs to a planet, removes a sinusoidal signal at the detected period and proceeds using the model residuals. If a peak is classified as not belonging to a planet, the procedure stops. The FAP method was again used as a comparison for the performance of ExoplANNET used as part of the Virtual Astronomer. Overall, our new method exhibits a better precision metric than the FAP (0.93 vs. 0.91), while keeping a similar recall metric.
However, more planets are detected when using Virtual Astronomer with the FAP method, but at the expense of a larger number of false positives. It is probably the higher false-positive rate that allows Virtual Astronomer with the FAP method to evaluate periodograms that follow from a false detection. The same periodogram might be ignored by the Virtual Astronomer using the ExoplANNET model if the first peak is correctly identified as noise. Indeed, we see that the number of missed planets (i.e. planets that are not even evaluated by the algorithm) is larger under ExoplANNET.
The behaviour of the detection metrics as a function of the period of the signal being detected shows a qualitative difference between ExoplANNET and the traditional FAP method. While the FAP retains a relatively constant recall across the entire period range, the neural network seems to have learnt to be more ‘cautious’ in the period range associated with stellar rotation, and therefore activity. As a consequence, while both methods lose precision at this period range, the precision of ExoplANNET remains greater than that of the FAP. This is precisely the reason implementations using machine learning algorithms are useful. As mentioned in Sect. 1, the objective is to bypass the modelling of the stellar activity and nevertheless be able to distinguish between bona fide planets and spurious RV signals. In this sense, the comparison with the FAP method is unfair: the traditional method is not even intended to distinguish activity from planets, but merely to claim statistical significance of a signal. Our machine learning method is therefore producing two results at the same time: an assessment of the significance of a signal and an identification of its nature.
The model robustness was studied by removing measurements from the simulations with different criteria. The results show that the network retains much of its performance even when 60 points (30%) are removed, independently of how they are removed.
On the other hand, application on real signals shows that, while the network adequately identifies a known planet, its performance would likely be degraded if employed on long time series typical of RV surveys. This is likely due to the much narrower peaks associated with long time series compared to the simulated datasets used for training. Future work will address this limitation, which would require significant changes to both the network architecture and the dataset simulation procedure.
Future work shall focus on evaluating the performance on a larger sample of real time series. This will be done by performing simulations with realistic time sampling and on actual observed data, while taking into account the fact that the sampling method and the number of points are crucial parameters in the simulations. In addition, neural networks can be provided with rich context to the classification task in the form of additional data. In our case, ExoplANNET takes the position and power of the largest peak in the periodogram. Additional information can come in the form of the stellar rotational period and the spectral type, for example. Implementing and exploring these possibilities will constitute avenues for future advancement.
Acknowledgements
Part of this work was carried out at the Geneva Observatory and financed by the Seed Money project Grant 2018 “Towards the Detection of Earth Analogues (TDEA)” of the State Secretariat for Education, Research and Innovation, Switzerland.
Appendix A Descarted approaches
During the design phase of ExopANNet, several combinations of convolutional and pooling layers were explored before reaching the final architecture. Overall, the results obtained with different numbers of layers and filters were very similar. It quickly became apparent that the difficulty of the problem did not pose a significant challenge for this type of network, and therefore the most simple combination that produced good results was chosen.
However, the main issue was determining the appropriate way to model the problem. Many options were considered before arriving at the proposed solution of using CNNs on periodograms:
Initially, the approach involved using the RV time series and treating the problem as a classification task, with each number of planets representing a separate class. We experimented with convolutional and LSTM networks. However, it very quickly became clear that this classification approach did not fit the problem well, as the classes were not mutually exclusive. Consequently, the tests did not yield any substantial improvements over random classification.
After discarding the classification approach, the focus shifted towards using periodograms and treating the problem as a linear regression task. In this approach, the network was designed to receive a periodogram as input and generate a real number between 0 and 4, representing the estimated number of planets present. Although the network demonstrated the ability to differentiate between periodograms with and without planets, the results were somewhat imprecise. Further analysis revealed an interesting pattern: the network appeared to be performing a form of ‘sum of powers’ calculation on the peaks. Periodograms with higher peak values tended to yield numbers closer to 4, while lower peak values resulted in smaller output values, regardless of the actual number of peaks present in the periodogram.
Before finding the proposed solution outlined in this work, an alternative test was conducted. The initial idea was to input the periodogram directly into the network, which would then identify the peaks associated with planets and output the position of those peaks. While this approach was ambitious, it posed significant challenges in terms of validation and practical implementation. One of the main difficulties arose when the network predicted a position between two peaks, making it impossible to determine which peak should be chosen. Consequently, this approach was deemed infeasible in practice.
Although these tests were inconclusive, they served to better understand the problem and the capabilities of the network and led us to the proposed solution.
Appendix B Convolutional neural networks
In this Appendix, we very briefly summarise the general concepts and usage of convolutional networks. Notions such as layer or backpropagation, and the generalities of artificial neurons (activation function, synaptic weight, bias, etc.) are assumed to be known. Those wishing to further investigate theoretical and implementation concepts can refer to the bibliography (Bishop (2007); Hertz et al. (1991); Goodfellow et al. (2016)).
Deep fully connected networks have achieved very good practical results used in a wide variety of problems. However, for the treatment of images, they have a disadvantage in that they do not take into account the spatial structure of the image. As a consequence, they can become extremely inefficient. On the other hand, CNNs are specifically designed to tackle tasks of computer vision. These networks use convolutions instead of classical matrix operations and were created to work with images, but are also useful for one-dimensional data where the structure of the data is relevant.
Broadly speaking, CNNs perform the following steps when processing an image:
Feature extraction: Each neuron takes its synaptic inputs from a local receptive field, that is, a small region in the previous layer, and combines them to extract local features.
-
Feature mapping: Each layer of the network is made up of many feature maps, each in the form of a plane within which individual neurons are forced to share the same set of synaptic weights. This second form of structural restriction has the following beneficial effects:
Translational invariance, achieved by performing the convolution operation on a feature map with a small kernel, followed by applying the activation function. A kernel is a small matrix of weights with which the image is convoluted.
Reduced number of parameters, achieved through the use of shared weights.
Subsampling: Convolutional layers are often followed by a layer that performs local averaging and subsampling, thus reducing the resolution of the feature map. This operation has the effect of reducing the sensitivity of the feature map output.
In this way, a deep network is obtained that detects lines or curves in its first layers, and, as it progresses, detects more complex shapes such as a face or a silhouette (Zeiler & Fergus 2014). To make a feature map, a kernel is applied to an image; this kernel on the image is the ‘receptive field’ that a neuron ‘sees’. In Figure B.1, there is an example of how a characteristics map is generated. In the example, a 3x3 kernel is applied on a 5x5 image11.
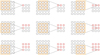 |
Fig. B.1 Generation of a feature map using one kernel. |
The size of the kernel is one of the parameters chosen when creating the network. They are usually small, in order to extract local characteristics. To find many of these features, many kernels are used. They all have the same dimension, but the weights they learn are different (they look for different things). This set of kernels is what is called a filter.
Next, we focus on how downsampling layers work and why they are needed, using the classic MNIST dataset (Deng 2012) as an example. This dataset consists of tens of thousands of handwritten digit images, which are in black and white and with a resolution of 28x28 pixels. Each image represents a digit of between zero and nine.
In Figure B.2, we can see how applying a filter of 32 kernels of 3x3 gives 32 activation maps of 26x26 each12, and so the number of neurons in this first hidden layer is 21,632.
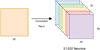 |
Fig. B.2 First hidden layer. |
The size of the information after the first layer has increased considerably. Consider this is a very small image, and it is only the first layer; adding more layers can make this number grow very quickly. Eventually, this hinders the training of a network on large high-definition images, because the network will lose the ability to abstract. This is where the downsampling layer comes in.
The most used implementation is max pooling. In this mechanism, we seek to reduce the parameters by dividing the input matrix into parts and keeping the maximum value of each one. Max pooling seeks to preserve the most important characteristics and reduce the dimensions of the data. In Figure B.3 there is an example of its application.
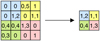 |
Fig. B.3 Max pooling. |
Figure B.4 shows the result of using this layer over the output of Figure B.2.
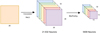 |
Fig. B.4 Use of max pooling for dimensionality reduction. |
As expected, the number of layers required to reach good performance, and the manner in which they are interleaved, depend on the problem to be solved, and there is no general rule. But in general, the convolutional network extracts the most relevant features from the image and then connects them to one or more fully connected layers and an output layer used for classification. This layer depends on the problem. In this particular example, it has a neuron for each category – here, ten neurons – and uses a softmax activation function. This activation function normalises the outputs of the output layer so that each value can be interpreted as the probability of belonging to a given class. The fully connected part, together with the output layer, uses the information extracted in the convolutional part, and ‘decides’ to which category the entry belongs. Figure B.5 shows a general diagram of the network in this example.
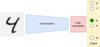 |
Fig. B.5 Full network. |
References
- Ambikasaran, S., Foreman-Mackey, D., Greengard, L., Hogg, D. W., & O’Neil, M. 2015, IEEE Trans. Pattern Anal. Mach. Intell., 38, 252 [Google Scholar]
- Anglada-Escudé, G., Amado, P. J., Barnes, J., et al. 2016, Nature, 536, 437 [Google Scholar]
- Angus, R., Morton, T., Aigrain, S., Foreman-Mackey, D., & Rajpaul, V. 2018, MNRAS, 474, 2094 [Google Scholar]
- Ansdell, M., Ioannou, Y., Osborn, H. P., et al. 2018, ApJ, 869, L7 [NASA ADS] [CrossRef] [Google Scholar]
- Armstrong, D. J., Pollacco, D., & Santerne, A. 2017, MNRAS, 465, 2634 [NASA ADS] [CrossRef] [Google Scholar]
- Armstrong, D. J., Günther, M. N., McCormac, J., et al. 2018, MNRAS, 478, 4225 [NASA ADS] [CrossRef] [Google Scholar]
- Astudillo-Defru, N., Díaz, R. F., Bonfils, X., et al. 2017a, A&A, 605, A11 [Google Scholar]
- Astudillo-Defru, N., Forveille, T., Bonfils, X., et al. 2017b, A&A, 602, A88 [NASA ADS] [CrossRef] [EDP Sciences] [Google Scholar]
- Baluev, R. V. 2008, MNRAS, 385, 1279 [Google Scholar]
- Banko, M., & Brill, E. 2001, in Proceedings of the 39th Annual Meeting on Association for Computational Linguistics, ACL ’01 (USA: Association for Computational Linguistics), 26 [Google Scholar]
- Baranne, A., Queloz, D., Mayor, M., et al. 1996, A&As, 119, 373 [NASA ADS] [CrossRef] [EDP Sciences] [Google Scholar]
- Bishop, C. M. 2007, Pattern Recognition and Machine Learning (Information Science and Statistics), 1st edn. (Springer) [Google Scholar]
- Blackman, R. T., Fischer, D. A., Jurgenson, C. A., et al. 2020, AJ, 159, 238 [CrossRef] [Google Scholar]
- Boisse, I., Moutou, C., Vidal-Madjar, A., et al. 2009, A&A, 495, 959 [NASA ADS] [CrossRef] [EDP Sciences] [Google Scholar]
- Bonfils, X., Delfosse, X., Udry, S., et al. 2013, A&A, 549, A109 [NASA ADS] [CrossRef] [EDP Sciences] [Google Scholar]
- Bonfils, X., Astudillo-Defru, N., Díaz, R., et al. 2018, A&A, 613, A25 [NASA ADS] [CrossRef] [EDP Sciences] [Google Scholar]
- Bouchy, F., Díaz, R. F., Hébrard, G., et al. 2013, A&A, 549, A49 [NASA ADS] [CrossRef] [EDP Sciences] [Google Scholar]
- Broomhall, A.-M., Chaplin, W. J., Davies, G. R., et al. 2009, MNEAS, 396, L100 [Google Scholar]
- Cloutier, R., Astudillo-Defru, N., Doyon, R., et al. 2017, A&A, 608, A35 [NASA ADS] [CrossRef] [EDP Sciences] [Google Scholar]
- Dattilo, A., Vanderburg, A., Shallue, C. J., et al. 2019, AJ, 157, 169 [NASA ADS] [CrossRef] [Google Scholar]
- de Beurs, Z. L., Vanderburg, A., Shallue, C. J., et al. 2020, Identifying Exoplanets with Deep Learning. IV. Removing Stellar Activity Signals from Radial Velocity Measurements Using Neural Networks [Google Scholar]
- Delisle, J. B., Ségransan, D., Dumusque, X., et al. 2018, A&A, 614, A133 [NASA ADS] [CrossRef] [EDP Sciences] [Google Scholar]
- Delisle, J. B., Unger, N., Hara, N. C., & Ségransan, D. 2022, A&A, 659, A182 [NASA ADS] [CrossRef] [EDP Sciences] [Google Scholar]
- Deng, L. 2012, IEEE Signal Process. Mag., 29, 141 [CrossRef] [Google Scholar]
- Devlin, J., Chang, M.-W., Lee, K., & Toutanova, K. 2019, in Proceedings of the 2019 Conference of the North American Chapter of the Association for Computational Linguistics: Human Language Technologies, Vol. 1 (Long and Short Papers) (Minneapolis, Minnesota: Association for Computational Linguistics), 4171 [Google Scholar]
- Díaz, R. F., Ségransan, D., Udry, S., et al. 2016, A&A, 585, A134 [Google Scholar]
- Díaz, R. F., Delfosse, X., Hobson, M. J., et al. 2019, A&A, 625, A17 [NASA ADS] [CrossRef] [EDP Sciences] [Google Scholar]
- Dreizler, S., Jeffers, S. V., Rodríguez, E., et al. 2020, MNRAS, 493, 536 [Google Scholar]
- Dumusque, X., Santos, N. C., Udry, S., Lovis, C., & Bonfils, X. 2011a, A&A, 527, A82 [NASA ADS] [CrossRef] [EDP Sciences] [Google Scholar]
- Dumusque, X., Udry, S., Lovis, C., Santos, N. C., & Monteiro, M. J. P. F. G. 2011b, A&A, 525, A140 [NASA ADS] [CrossRef] [EDP Sciences] [Google Scholar]
- Espinoza, N., Kossakowski, D., & Brahm, R. 2019, MNRAS, 490, 2262 [Google Scholar]
- Feng, F., Tuomi, M., Jones, H. R. A., et al. 2017, AJ, 154, 135 [Google Scholar]
- Foreman-Mackey, D., Agol, E., Ambikasaran, S., & Angus, R. 2017, AJ, 154, 220 [Google Scholar]
- Frodesen, A. G., Skjeggestad, O., & Tøfte, H. 1979, Probability and Statistics in Particle Physics (Universitetforlaget) [Google Scholar]
- Giles, H. A. C., Collier Cameron, A., & Haywood, R. D. 2017, MNRAS, 472, 1618 [Google Scholar]
- Goodfellow, I., Bengio, Y., & Courville, A. 2016, Deep Learning (MIT Press) [Google Scholar]
- Halevy, A., Norvig, P., & Pereira, F. 2009, IEEE Intell. Syst., 24, 8 [CrossRef] [Google Scholar]
- Haywood, R. D., Collier Cameron, A., Queloz, D., et al. 2014, MNRAS, 443, 2517 [Google Scholar]
- He, K., Zhang, X., Ren, S., & Sun, J. 2016, in Proceedings of the IEEE Conference on Computer Vision and Pattern Recognition, 770 [Google Scholar]
- Hertz, J., Krogh, A., & Palmer, R. G. 1991, Introduction to the Theory of Neural Computation (USA: Addison-Wesley Longman Publishing Co., Inc.) [Google Scholar]
- Howard, A. W., Marcy, G. W., Johnson, J. A., et al. 2010, Science, 330, 653 [Google Scholar]
- Jurgenson, C., Fischer, D., McCracken, T., et al. 2016, SPIE Conf. Ser., 9908, 99086T [Google Scholar]
- Khan, M. S., Jenkins, J., & Yoma, N. 2017, IEEE Signal Process. Mag., 34 [Google Scholar]
- Krizhevsky, A., Sutskever, I., & Hinton, G. E. 2012, Adv. Neural Inform. Process. Syst., 25, 1097 [Google Scholar]
- Landau, E. 2017, Overlooked Treasure: The First Evidence of Exoplanets, https://www.jpl.nasa.gov/news/news.php?feature=6991 [Google Scholar]
- Lecun, Y., Bottou, L., Bengio, Y., & Haffner, P. 1998, Proc. IEEE, 86, 2278 [Google Scholar]
- Lefebvre, S., García, R. A., Jiménez-Reyes, S. J., Turck-Chièze, S., & Mathur, S. 2008, A&A, 490, 1143 [NASA ADS] [CrossRef] [EDP Sciences] [Google Scholar]
- Lomb, N. R. 1976, Ap&SS, 39, 447 [Google Scholar]
- Lovis, C., Mayor, M., Pepe, F., et al. 2006, Nature, 441, 305 [NASA ADS] [CrossRef] [Google Scholar]
- Lovis, C., Dumusque, X., Santos, N. C., et al. 2011, ArXiv e-prints [arXiv:1107.5325] [Google Scholar]
- Luque, R., Pallé, E., Kossakowski, D., et al. 2019, A&A, 628, A39 [NASA ADS] [CrossRef] [EDP Sciences] [Google Scholar]
- Mamajek, E. E., & Hillenbrand, L. A. 2008, ApJ, 687, 1264 [Google Scholar]
- Mayor, M., & Queloz, D. 1995, Nature, 378, 355 [Google Scholar]
- Mayor, M., Pepe, F., Queloz, D., et al. 2003, The Messenger, 114, 20 [NASA ADS] [Google Scholar]
- Mayor, M., Udry, S., Lovis, C., et al. 2009, A&A, 493, 639 [NASA ADS] [CrossRef] [EDP Sciences] [Google Scholar]
- McCauliff, S. D., Jenkins, J. M., Catanzarite, J., et al. 2015, ApJ, 806, 6 [NASA ADS] [CrossRef] [Google Scholar]
- Meunier, N., Desort, M., & Lagrange, A.-M. 2010, A&A, 512, A39 [NASA ADS] [CrossRef] [EDP Sciences] [Google Scholar]
- Márquez-Neila, P., Fisher, C., Sznitman, R., & Heng, K. 2018, Nat. Astron., 2, 719 [CrossRef] [Google Scholar]
- Nelson, B. E., Ford, E. B., Buchner, J., et al. 2020, AJ, 159, 73 [Google Scholar]
- Nielsen, M. B., Gizon, L., Schunker, H., & Karoff, C. 2013, A&A, 557, A10 [NASA ADS] [CrossRef] [EDP Sciences] [Google Scholar]
- Osborn, H. P., Ansdell, M., Ioannou, Y., et al. 2020, A&A, 633, A53 [NASA ADS] [CrossRef] [EDP Sciences] [Google Scholar]
- Pearson, K. A., Palafox, L., & Griffith, C. A. 2018, MNRAS, 474, 478 [NASA ADS] [CrossRef] [Google Scholar]
- Pepe, F., Cristiani, S., Rebolo, R., et al. 2021, A&A, 645, A96 [NASA ADS] [CrossRef] [EDP Sciences] [Google Scholar]
- Perruchot, S., Kohler, D., Bouchy, F., et al. 2008, in SPIE Conference Series, 7014, 70140J [NASA ADS] [Google Scholar]
- Persson, C. M., Fridlund, M., Barragán, O., et al. 2018, A&A, 618, A33 [NASA ADS] [CrossRef] [EDP Sciences] [Google Scholar]
- Peters, M., Neumann, M., Iyyer, M., et al. 2018, in Proceedings of the 2018 Conference of the North American Chapter of the Association for Computational Linguistics: Human Language Technologies, Vol. 1 (Long Papers) (New Orleans, Louisiana: Association for Computational Linguistics), 2227 [Google Scholar]
- Quirrenbach, A., Amado, P. J., Caballero, J. A., et al. 2014, SPIE Conf. Ser., 9147, 91471F [Google Scholar]
- Rajpaul, V., Aigrain, S., Osborne, M. A., Reece, S., & Roberts, S. 2015, MNRAS, 452, 2269 [Google Scholar]
- Rao, S., Mahabal, A., Rao, N., & Raghavendra, C. 2021, MNRAS, 502, 2845 [NASA ADS] [CrossRef] [Google Scholar]
- Rasmussen, C. E., & Williams, C. K. I. 2005, Gaussian Processes for Machine Learning (Adaptive Computation and Machine Learning) (The MIT Press) [Google Scholar]
- Saar, S. H., & Donahue, R. A. 1997, ApJ, 485, 319 [Google Scholar]
- Saha, S., Mathur, A., Bora, K., Agrawal, S., & Basak, S. 2018, in 2018 International Conference on Advances in Computing, Communications and Informatics (ICACCI), Bangalore, India, 1781 [CrossRef] [Google Scholar]
- Scargle, J. D. 1982, ApJ, 263, 835 [Google Scholar]
- Schrijver, C. J., & Zwaan, C. 2000, Solar and Stellar Magnetic Activity, Cambridge Astrophysics (Cambridge University Press) [CrossRef] [Google Scholar]
- Shallue, C. J., & Vanderburg, A. 2018, AJ, 155, 94 [NASA ADS] [CrossRef] [Google Scholar]
- Suárez Mascareño, A., Faria, J. P., Figueira, P., et al. 2020, A&A, 639, A77 [Google Scholar]
- Tuomi, M., Anglada-Escudé, G., Gerlach, E., et al. 2013, A&A, 549, A48 [NASA ADS] [CrossRef] [EDP Sciences] [Google Scholar]
- Udry, S., Dumusque, X., Lovis, C., et al. 2019, A&A, 622, A37 [NASA ADS] [CrossRef] [EDP Sciences] [Google Scholar]
- VanderPlas, J. T. 2018, ApJS, 236, 16 [Google Scholar]
- Waldmann, I. P. 2016, ApJ, 820, 107 [NASA ADS] [CrossRef] [Google Scholar]
- Wolszczan, A., & Frail, D. A. 1992, Nature, 355, 145 [CrossRef] [Google Scholar]
- Wright, D. J., Wittenmyer, R. A., Tinney, C. G., Bentley, J. S., & Zhao, J. 2016, ApJ, 817, L20 [NASA ADS] [CrossRef] [Google Scholar]
- Yu, L., Donati, J. F., Hébrard, E. M., et al. 2017, MNRAS, 467, 1342 [Google Scholar]
- Yu, L., Vanderburg, A., Huang, C., et al. 2019, AJ, 158, 25 [NASA ADS] [CrossRef] [Google Scholar]
- Zechmeister, M., & Kürster, M. 2009, A&A, 496, 577 [CrossRef] [EDP Sciences] [Google Scholar]
- Zechmeister, M., Dreizler, S., Ribas, I., et al. 2019, A&A, 627, A49 [NASA ADS] [EDP Sciences] [Google Scholar]
- Zeiler, M. D., & Fergus, R. 2014, in Computer Vision–ECCV 2014: 13th European Conference, Zurich, Switzerland, September 6–12, 2014, Proceedings, Part I 13 (Springer), 818 [Google Scholar]
- Zucker, S., & Giryes, R. 2018, AJ, 155, 147 [NASA ADS] [CrossRef] [Google Scholar]
In the exoplanet literature, this is often referred to as the false alarm probability (FAP). Although we deem this terminology misleading, we use p-value and FAP interchangeably.
The sampling may be seen as done in sidereal days.
Here, we use ‘error terms’ to refer to the unknown terms that make the observed velocities deviate from the model. In contrast, the term ‘uncertainties’ is reserved to the experimental error associated with each measurement.
See references in the Introduction for a number of examples of articles using Gaussian Processes with this kernel.
In Apendix B, there is a brief explanation of this type of network and its use in data that have a spatial relationship, such as images or periodograms.
To mention another advantage, the network occupies only 1.7 kB of memory.
The executions were on a desktop computer with a 2.3 GHz micro Intel Core I5 with 8 Gb of RAM.
We reiterate that the peak power is a comparison of the x2 of a sinusoidal model with a constant one.
For simplicity, these examples are presented on matrices in two dimensions, assuming black and white images. If they were colour images, it would be necessary to add a dimension to the input and the kernel. In that case, we would have three filters; these three filters are added together with the bias and they form an output as if it were a single channel.
All Tables
Execution times in seconds for the analysis of a single periodogram with ExoplANNET and FAP methods.
Precision and recall of the Virtual Astronomer using the classical FAP method and ExoplANNET to decide on the nature of periodogram peaks.
Performance of ExoplANNET under different simulated time series sampling and number of points.
All Figures
|
Fig. 1 RV measurements (left) and their periodogram (right), the red line marks the peak that represents the period with the highest power. |
| In the text | |
|
Fig. 2 Stellar noise (left), the planetary signal with a period of 62 days and an amplitude of 10 m s−1 (centre), and the resulting composition (right). |
| In the text | |
|
Fig. 3 Architecture of the ExoplANNET neural network. Blue cells represent convolutional layers; pale orange cells are max pooling layers and dark red cells are fully connected layers. In addition, we show the single dropout layer in yellow and the output layer in green. |
| In the text | |
|
Fig. 4 Precision-recall curve and AUC of both methods over the periodograms of set 2. |
| In the text | |
|
Fig. 5 Distribution of output values over the periodograms of set 2 (probabilities and FAP values for the CNN and classical analysis, respectively). For each algorithm, the distribution of data labelled as planets and as noise is shown with different line styles. As there are 15 587 periodograms without planets for the 4413 planetary periodograms, the distributions are normalised for easier comparison. |
| In the text | |
|
Fig. 6 False positives (left) and false negatives (right) as a function of the threshold showing the lower and upper limit of the threshold where the network has both fewer false positives and fewer false negatives than the traditional method. The dashed horizontal lines show the number of incorrect detections with the FAP method, and the vertical segment aids in the identification of the corresponding probability threshold. |
| In the text | |
|
Fig. 7 False positives of the Virtual Astronomer with both implementations. |
| In the text | |
|
Fig. 8 Detections of both implementations of the Virtual Astronomer compared to the detections provided by a hypothetical optimal method with flawless decision making (see text for details). Each panel corresponds to 1000 systems with a given number of companions (upper left: 1000 stars with one planet; upper right: 1000 stars with two planets; lower left: 1000 stars with three planets; and lower right: 1000 stars with four planets). The number of planets detected by the flawless decision-making method is marked by dashed horizontal lines and indicated in red on the vertical axes. The bars present the true positives (i.e. detected planets; green), false negatives (blue), and the planets that were not detected (i.e. their peak was not evaluated; red). We note that even using the perfect method, more than half of the planets are missed. We also note that for systems with one planet, both FAP and ExoplANNET produce more planetary classifications than the flawless method. |
| In the text | |
|
Fig. 9 Precision (left) and recall (right) as a function of the period of the detected planets, using the threshold (thr) 0.77 for the network and 0.95 for the FAP (see Sect. 5.2). |
| In the text | |
|
Fig. 10 Precision (left) and recall (right) as a function of the power in the periodogram of the detected planets, using the threshold (thr) 0.77 for the network and 0.95 for the FAP. |
| In the text | |
|
Fig. 11 Periodograms of HARPS data of HD40307. Left: trimmed to resemble the sampling of the training set as closely as possible. Right: using the full dataset. |
| In the text | |
|
Fig. 12 Power and period of the largest peaks in the periodograms of set 3. The figure shows instances labelled by ExoplANNET as Planet, blue points indicate instances correctly classified, while red points show classification errors. |
| In the text | |
|
Fig. B.1 Generation of a feature map using one kernel. |
| In the text | |
|
Fig. B.2 First hidden layer. |
| In the text | |
|
Fig. B.3 Max pooling. |
| In the text | |
|
Fig. B.4 Use of max pooling for dimensionality reduction. |
| In the text | |
|
Fig. B.5 Full network. |
| In the text | |
Current usage metrics show cumulative count of Article Views (full-text article views including HTML views, PDF and ePub downloads, according to the available data) and Abstracts Views on Vision4Press platform.
Data correspond to usage on the plateform after 2015. The current usage metrics is available 48-96 hours after online publication and is updated daily on week days.
Initial download of the metrics may take a while.