Fig. 6
Download original image
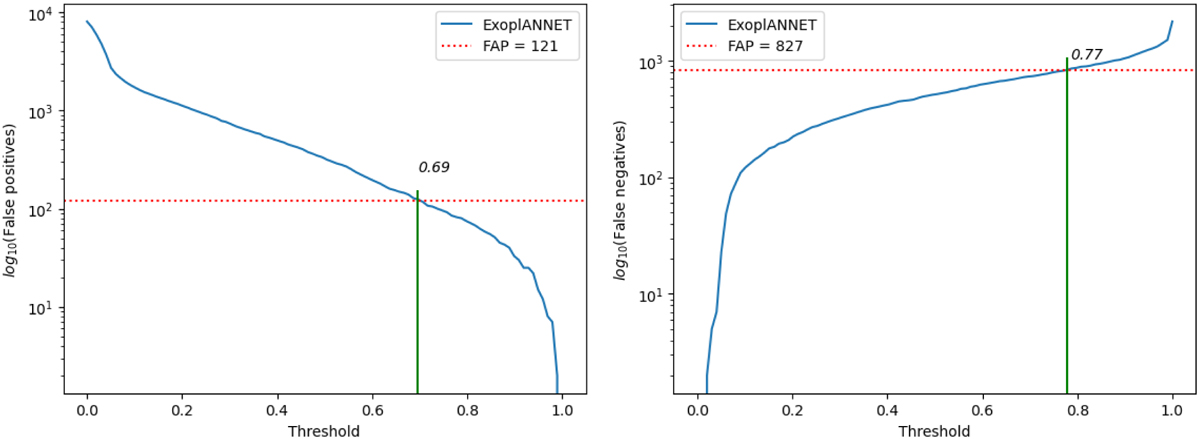
False positives (left) and false negatives (right) as a function of the threshold showing the lower and upper limit of the threshold where the network has both fewer false positives and fewer false negatives than the traditional method. The dashed horizontal lines show the number of incorrect detections with the FAP method, and the vertical segment aids in the identification of the corresponding probability threshold.
Current usage metrics show cumulative count of Article Views (full-text article views including HTML views, PDF and ePub downloads, according to the available data) and Abstracts Views on Vision4Press platform.
Data correspond to usage on the plateform after 2015. The current usage metrics is available 48-96 hours after online publication and is updated daily on week days.
Initial download of the metrics may take a while.