Fig. 5
Download original image
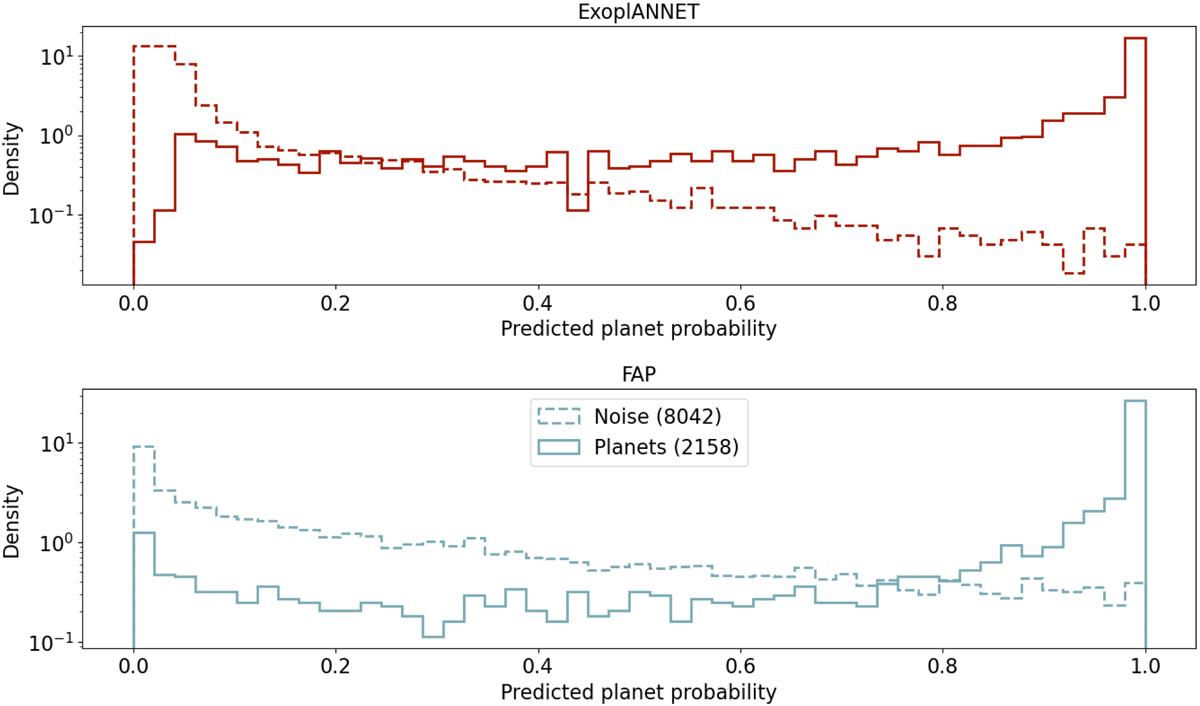
Distribution of output values over the periodograms of set 2 (probabilities and FAP values for the CNN and classical analysis, respectively). For each algorithm, the distribution of data labelled as planets and as noise is shown with different line styles. As there are 15 587 periodograms without planets for the 4413 planetary periodograms, the distributions are normalised for easier comparison.
Current usage metrics show cumulative count of Article Views (full-text article views including HTML views, PDF and ePub downloads, according to the available data) and Abstracts Views on Vision4Press platform.
Data correspond to usage on the plateform after 2015. The current usage metrics is available 48-96 hours after online publication and is updated daily on week days.
Initial download of the metrics may take a while.