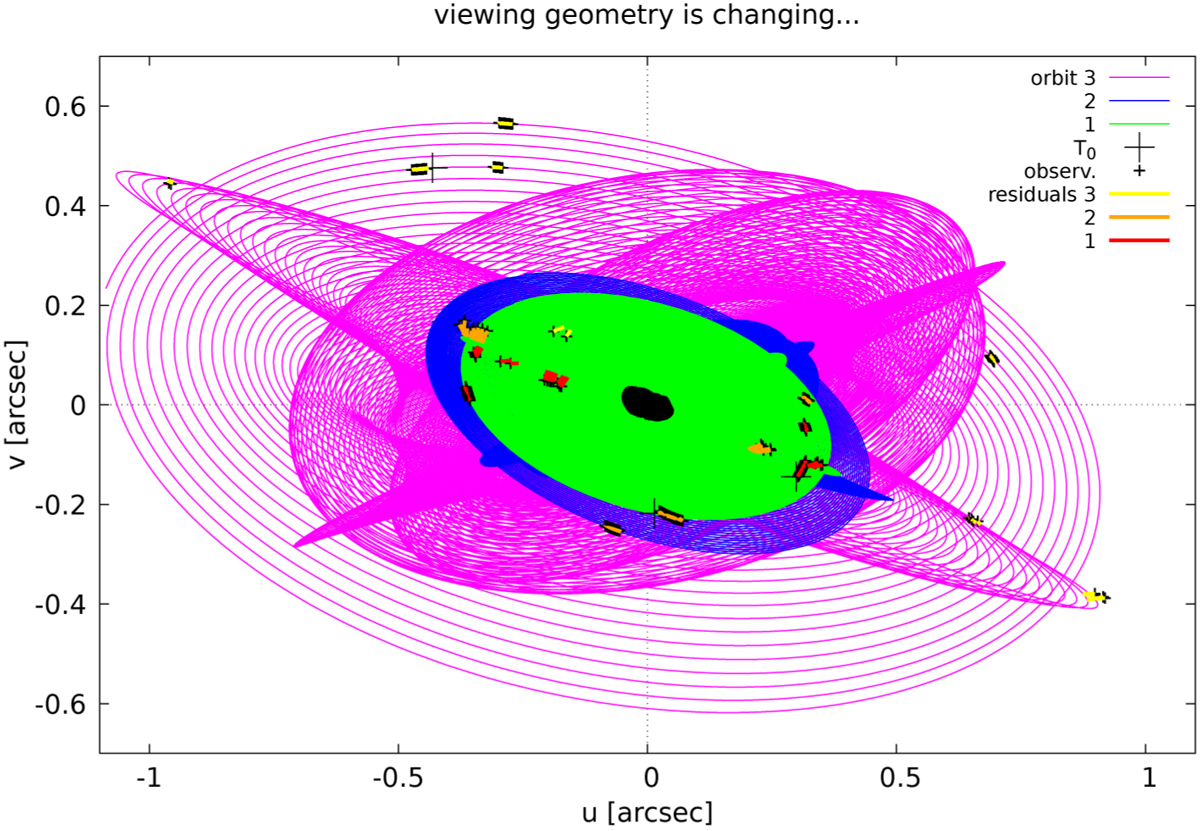
Fig. 7
Download original image
Quadrupole model of the orbits 1, 2, and 3 with χ2 = 1084 over the time-span of 1707 days. The orbits are plotted in the (u; υ) coordinates (green, blue and pink lines, respectively), together with observed positions (black crosses) and residuals (red, orange and yellow lines, respectively). Elektra’s shape for one of the epochs is overplotted in black.
Current usage metrics show cumulative count of Article Views (full-text article views including HTML views, PDF and ePub downloads, according to the available data) and Abstracts Views on Vision4Press platform.
Data correspond to usage on the plateform after 2015. The current usage metrics is available 48-96 hours after online publication and is updated daily on week days.
Initial download of the metrics may take a while.