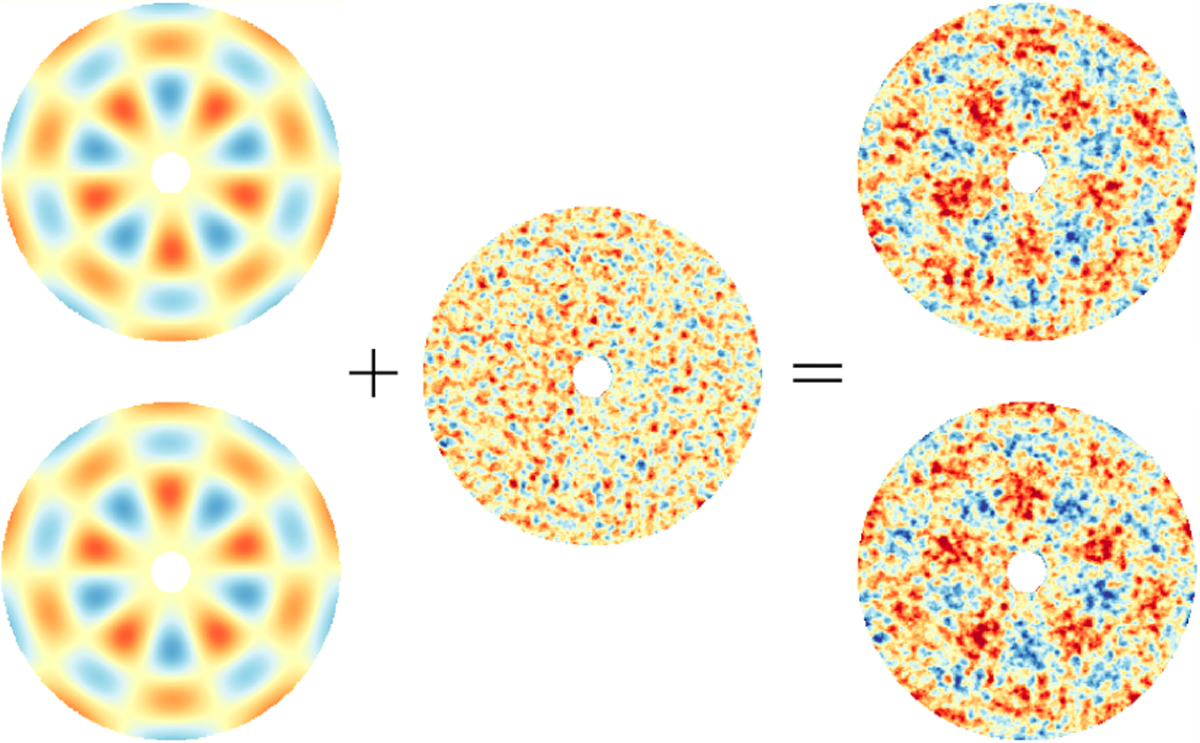
Fig. 1
Download original image
Example of the phase used to run a single step of the push-pull calibration with partial correction (for the 8 m-class telescope case and 0.2 m sup-aperture size): on the left part mode no. 50 of the modal base with positive (top, push) and negative (bottom, pull) sign, on the central part a random realization of the partial correction (i.e., turbulence residual), and on the right part the combination of mode and partial correction. The wavefront root mean square (RMS) of the mode is 40 nm and the wavefront RMS of the random realization of the partial correction is 46 nm (corresponding to the residual correction level expected for a seeing of 0.4arcsec). We note that these RMS values are selected for display purpose, in general, the amplitude of the push-pull (i.e., the wavefront RMS of the mode) is much smaller than the RMS of the partial correction.
Current usage metrics show cumulative count of Article Views (full-text article views including HTML views, PDF and ePub downloads, according to the available data) and Abstracts Views on Vision4Press platform.
Data correspond to usage on the plateform after 2015. The current usage metrics is available 48-96 hours after online publication and is updated daily on week days.
Initial download of the metrics may take a while.