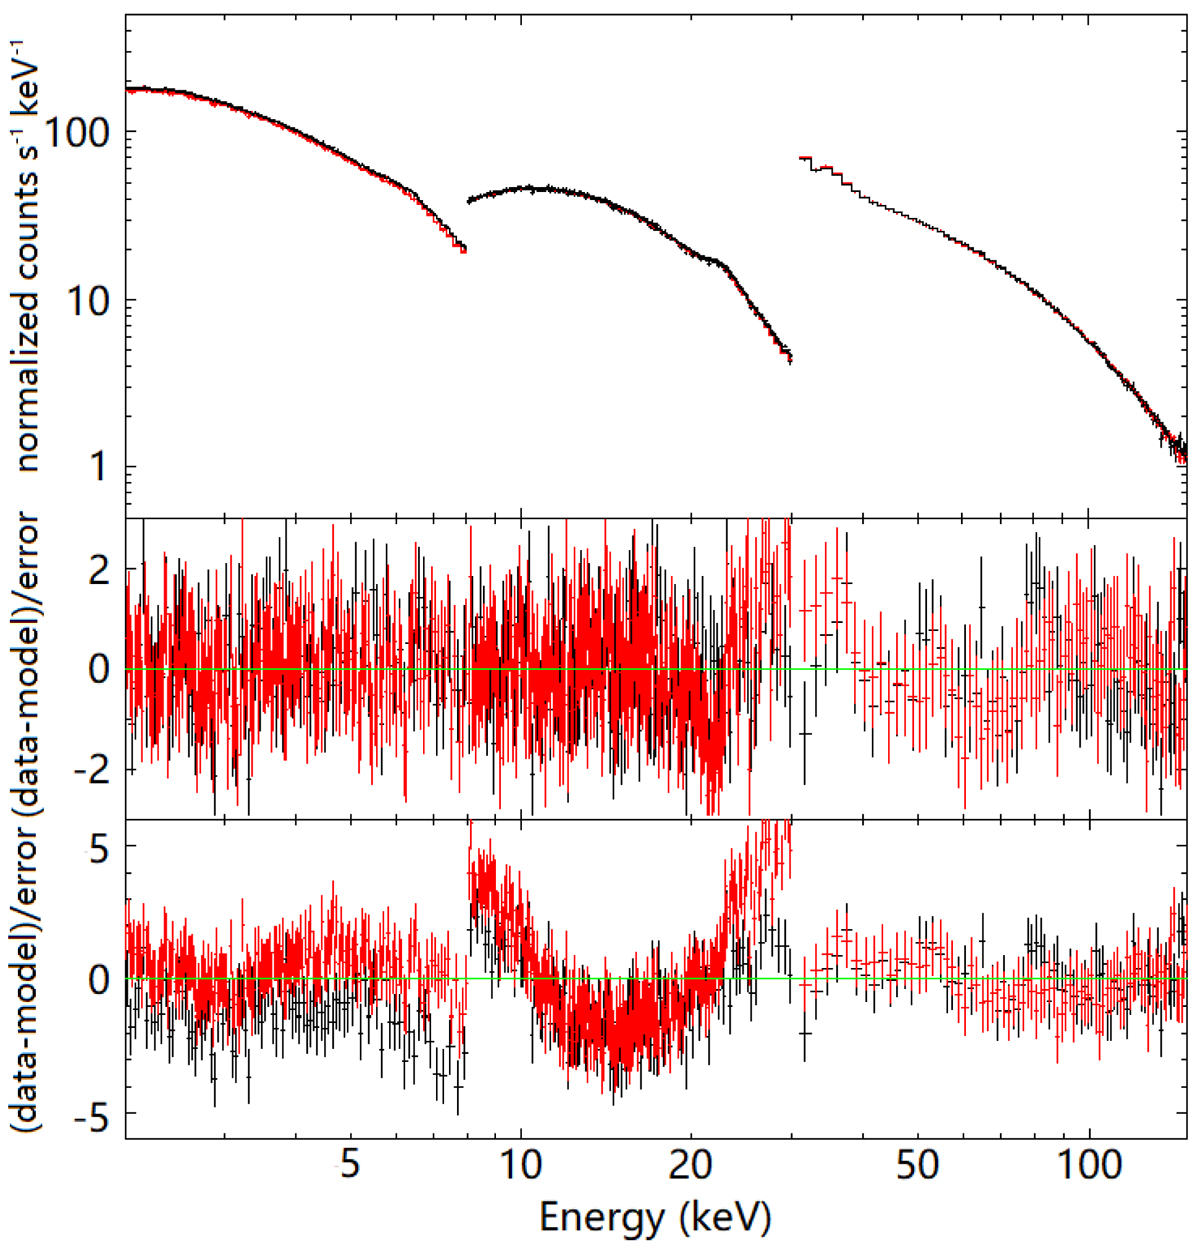
Fig. 4.
Download original image
Insight-HXMT spectrum from 2018 April 8 (ObsID P011466101502). Top panel: Spectrum fit with the model TBabs × constant × TBabs × (diskbb + gaussian + relxill). The black datapoints show observation intervals in which QPOs are detected, and red datapoints show non-QPO intervals. Middle panel: Residuals for the same spectral model. Bottom panel: Residuals when the same spectrum is fit with the simpler model constant × TBabs × (diskbb + gaussian + cutoffpl), i.e., without disk reflection.
Current usage metrics show cumulative count of Article Views (full-text article views including HTML views, PDF and ePub downloads, according to the available data) and Abstracts Views on Vision4Press platform.
Data correspond to usage on the plateform after 2015. The current usage metrics is available 48-96 hours after online publication and is updated daily on week days.
Initial download of the metrics may take a while.