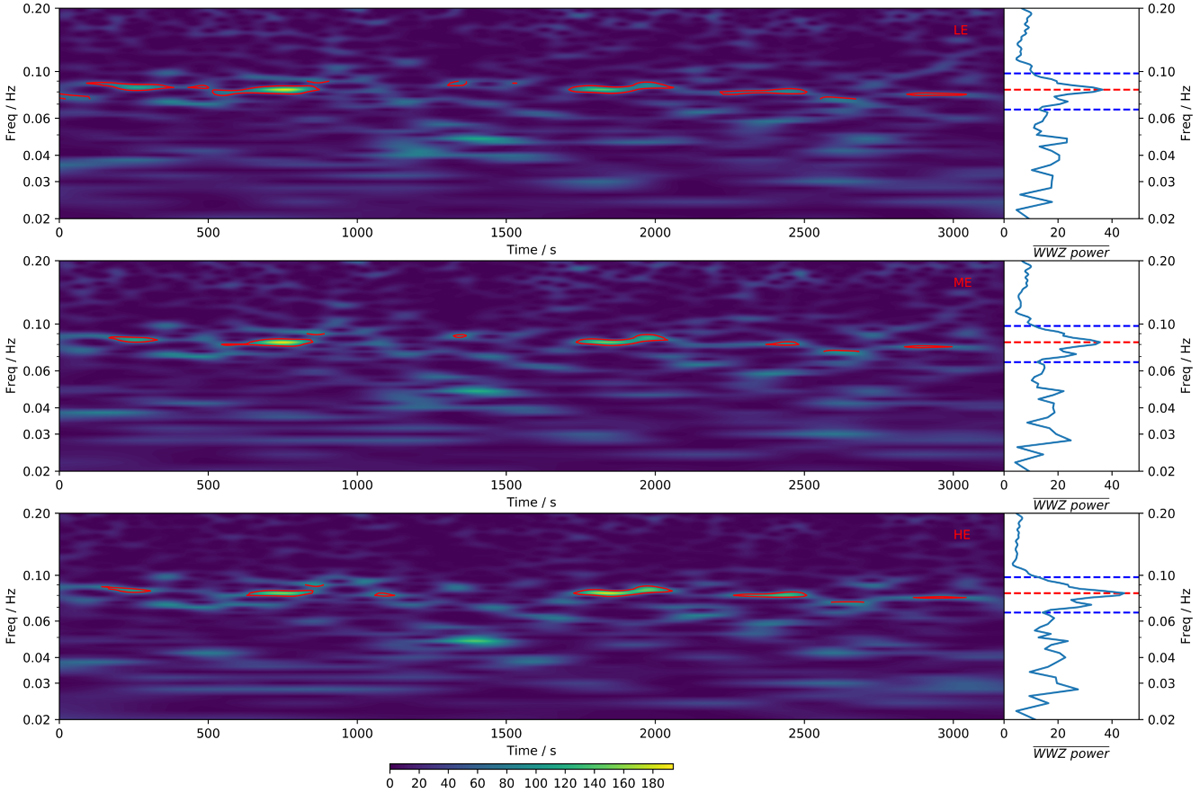
Fig. 2.
Download original image
2D plot on the left: Dynamic WWZ power in time-frequency space during ObsID P011466101502. The red contours represent regions (in time-frequency space) of QPO activity with a significance > 3σ. the units of WWZ power are (root-mean-square/mean)2 Hz−1. The line plot on the right side of all panels shows the corresponding time-averaged WWZ power spectrum over the whole observation in each band. The dashed red line indicates the peak power at a QPO frequency of 0.082 Hz, and the dashed blue lines correspond to ±20% around peak frequency. Top panel: For the HE data in the 30–250 keV band. Middle panel: For the ME data in the 5–30 keV band. Bottom panel: For the LE data in the 1.3–15.0 keV band.
Current usage metrics show cumulative count of Article Views (full-text article views including HTML views, PDF and ePub downloads, according to the available data) and Abstracts Views on Vision4Press platform.
Data correspond to usage on the plateform after 2015. The current usage metrics is available 48-96 hours after online publication and is updated daily on week days.
Initial download of the metrics may take a while.