Open Access
Fig. 1.
Download original image
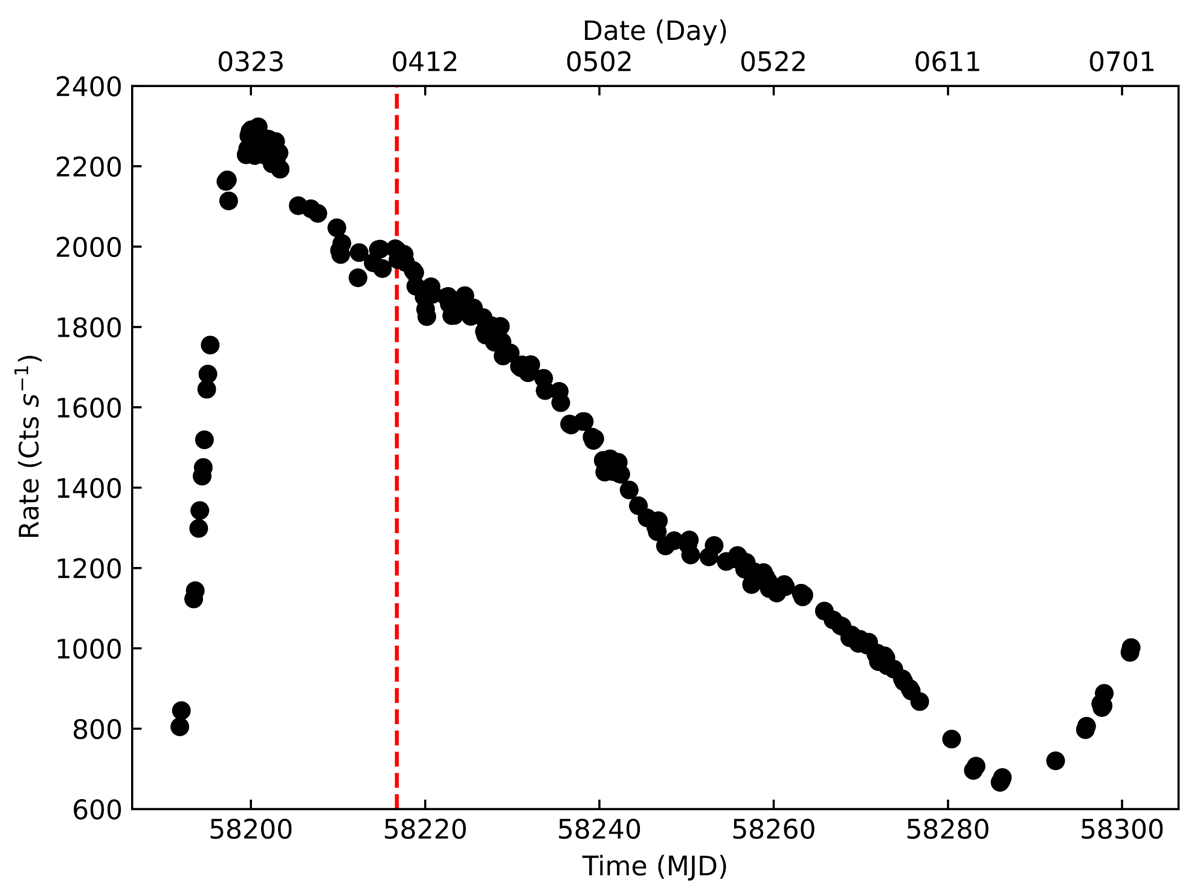
Insight-HXMT/HE light curve of MAXI J1820+070 in the 30–150 keV band during the 2018 LHS outburst. Calendar dates in the month – day format are reported on the top horizontal axis. The dotted red line marks the time of ObsID P01146610150 that was chosen for the dynamic QPO study in this work.
Current usage metrics show cumulative count of Article Views (full-text article views including HTML views, PDF and ePub downloads, according to the available data) and Abstracts Views on Vision4Press platform.
Data correspond to usage on the plateform after 2015. The current usage metrics is available 48-96 hours after online publication and is updated daily on week days.
Initial download of the metrics may take a while.