Fig. 5.
Download original image
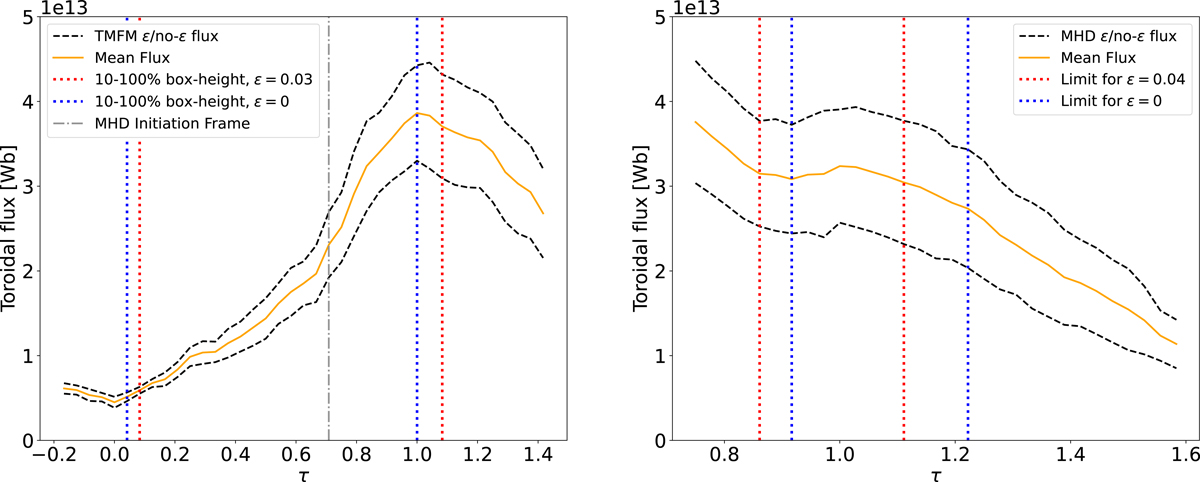
FR flux in the TMFM simulation as well as the zero-beta MHD simulation for the same event, with the normalised time τ on the x-axis (see Sect. 3.4). The red and blue pairs of dashed lines indicate the start and endpoints of the most relevant frames for the simulated FRs with and without taking ϵ into account, respectively. The dashed grey line in the TMFM plot indicates the initiation time for the zero-beta MHD simulation.
Current usage metrics show cumulative count of Article Views (full-text article views including HTML views, PDF and ePub downloads, according to the available data) and Abstracts Views on Vision4Press platform.
Data correspond to usage on the plateform after 2015. The current usage metrics is available 48-96 hours after online publication and is updated daily on week days.
Initial download of the metrics may take a while.