Fig. 9
Download original image
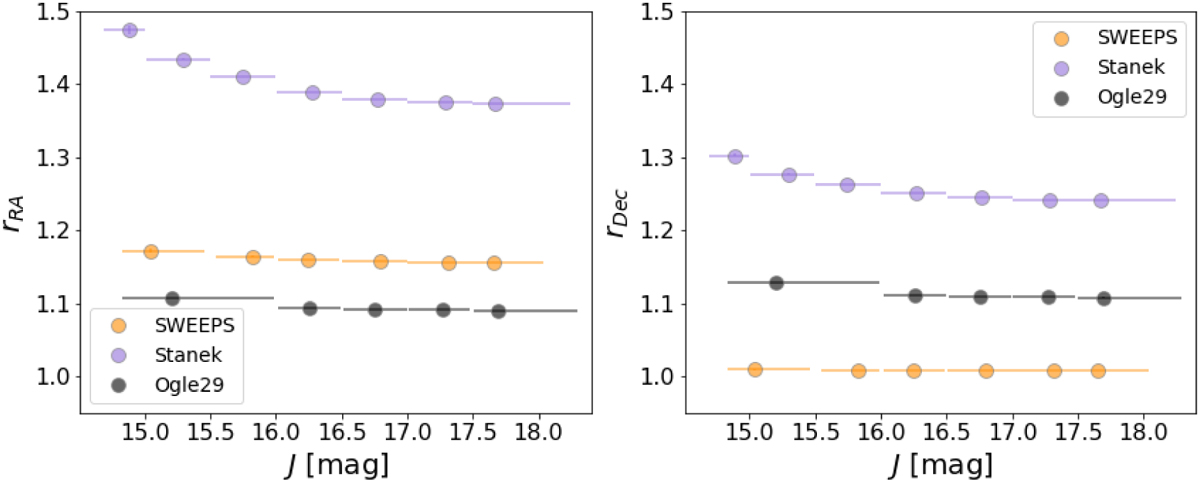
Dependence of the inflation factor r on VIRAC2 J magnitude. The proper motion comparison was made between VIRAC2 and the HST-BTP SWEEPS, Stanek, and Ogle29 windows. The points are the median values of J in each magnitude bin, and the error bars indicate the magnitude distribution at a given bin. In r, the error bars are the 16th and 84th percentile.
Current usage metrics show cumulative count of Article Views (full-text article views including HTML views, PDF and ePub downloads, according to the available data) and Abstracts Views on Vision4Press platform.
Data correspond to usage on the plateform after 2015. The current usage metrics is available 48-96 hours after online publication and is updated daily on week days.
Initial download of the metrics may take a while.