Fig. 7
Download original image
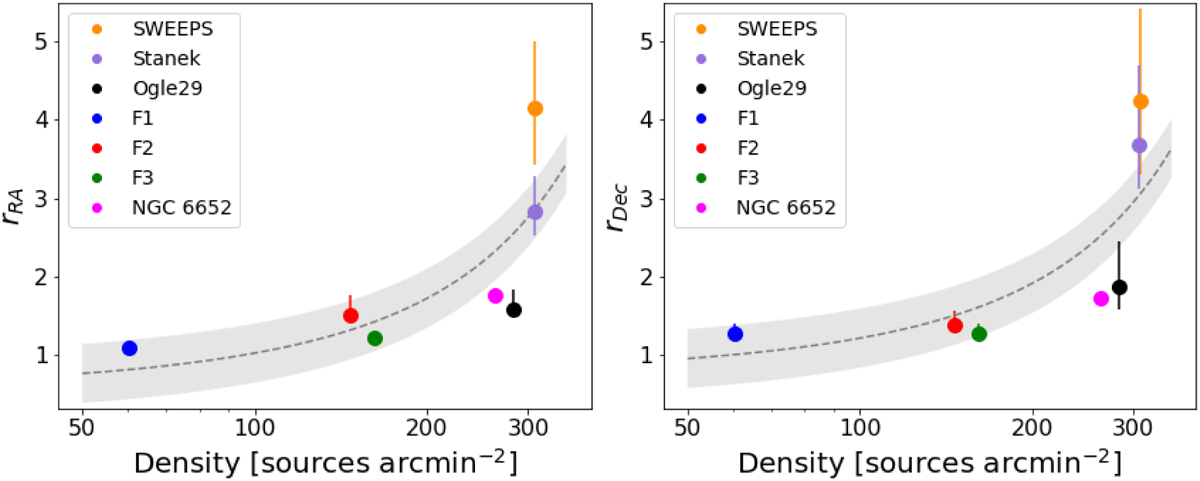
Dependence of the inflation factor r on the number density defined for sources found in the Gaia DR3 catalogue in a given field. The median r for the different fields is plotted with different colours. The error bars correspond to the 16th and 84th percentile in the distribution of r across the magnitude range of a given field. The shade is the 1σ uncertainty on the fit. The plotted data are listed in Table 3.
Current usage metrics show cumulative count of Article Views (full-text article views including HTML views, PDF and ePub downloads, according to the available data) and Abstracts Views on Vision4Press platform.
Data correspond to usage on the plateform after 2015. The current usage metrics is available 48-96 hours after online publication and is updated daily on week days.
Initial download of the metrics may take a while.