Fig. 6
Download original image
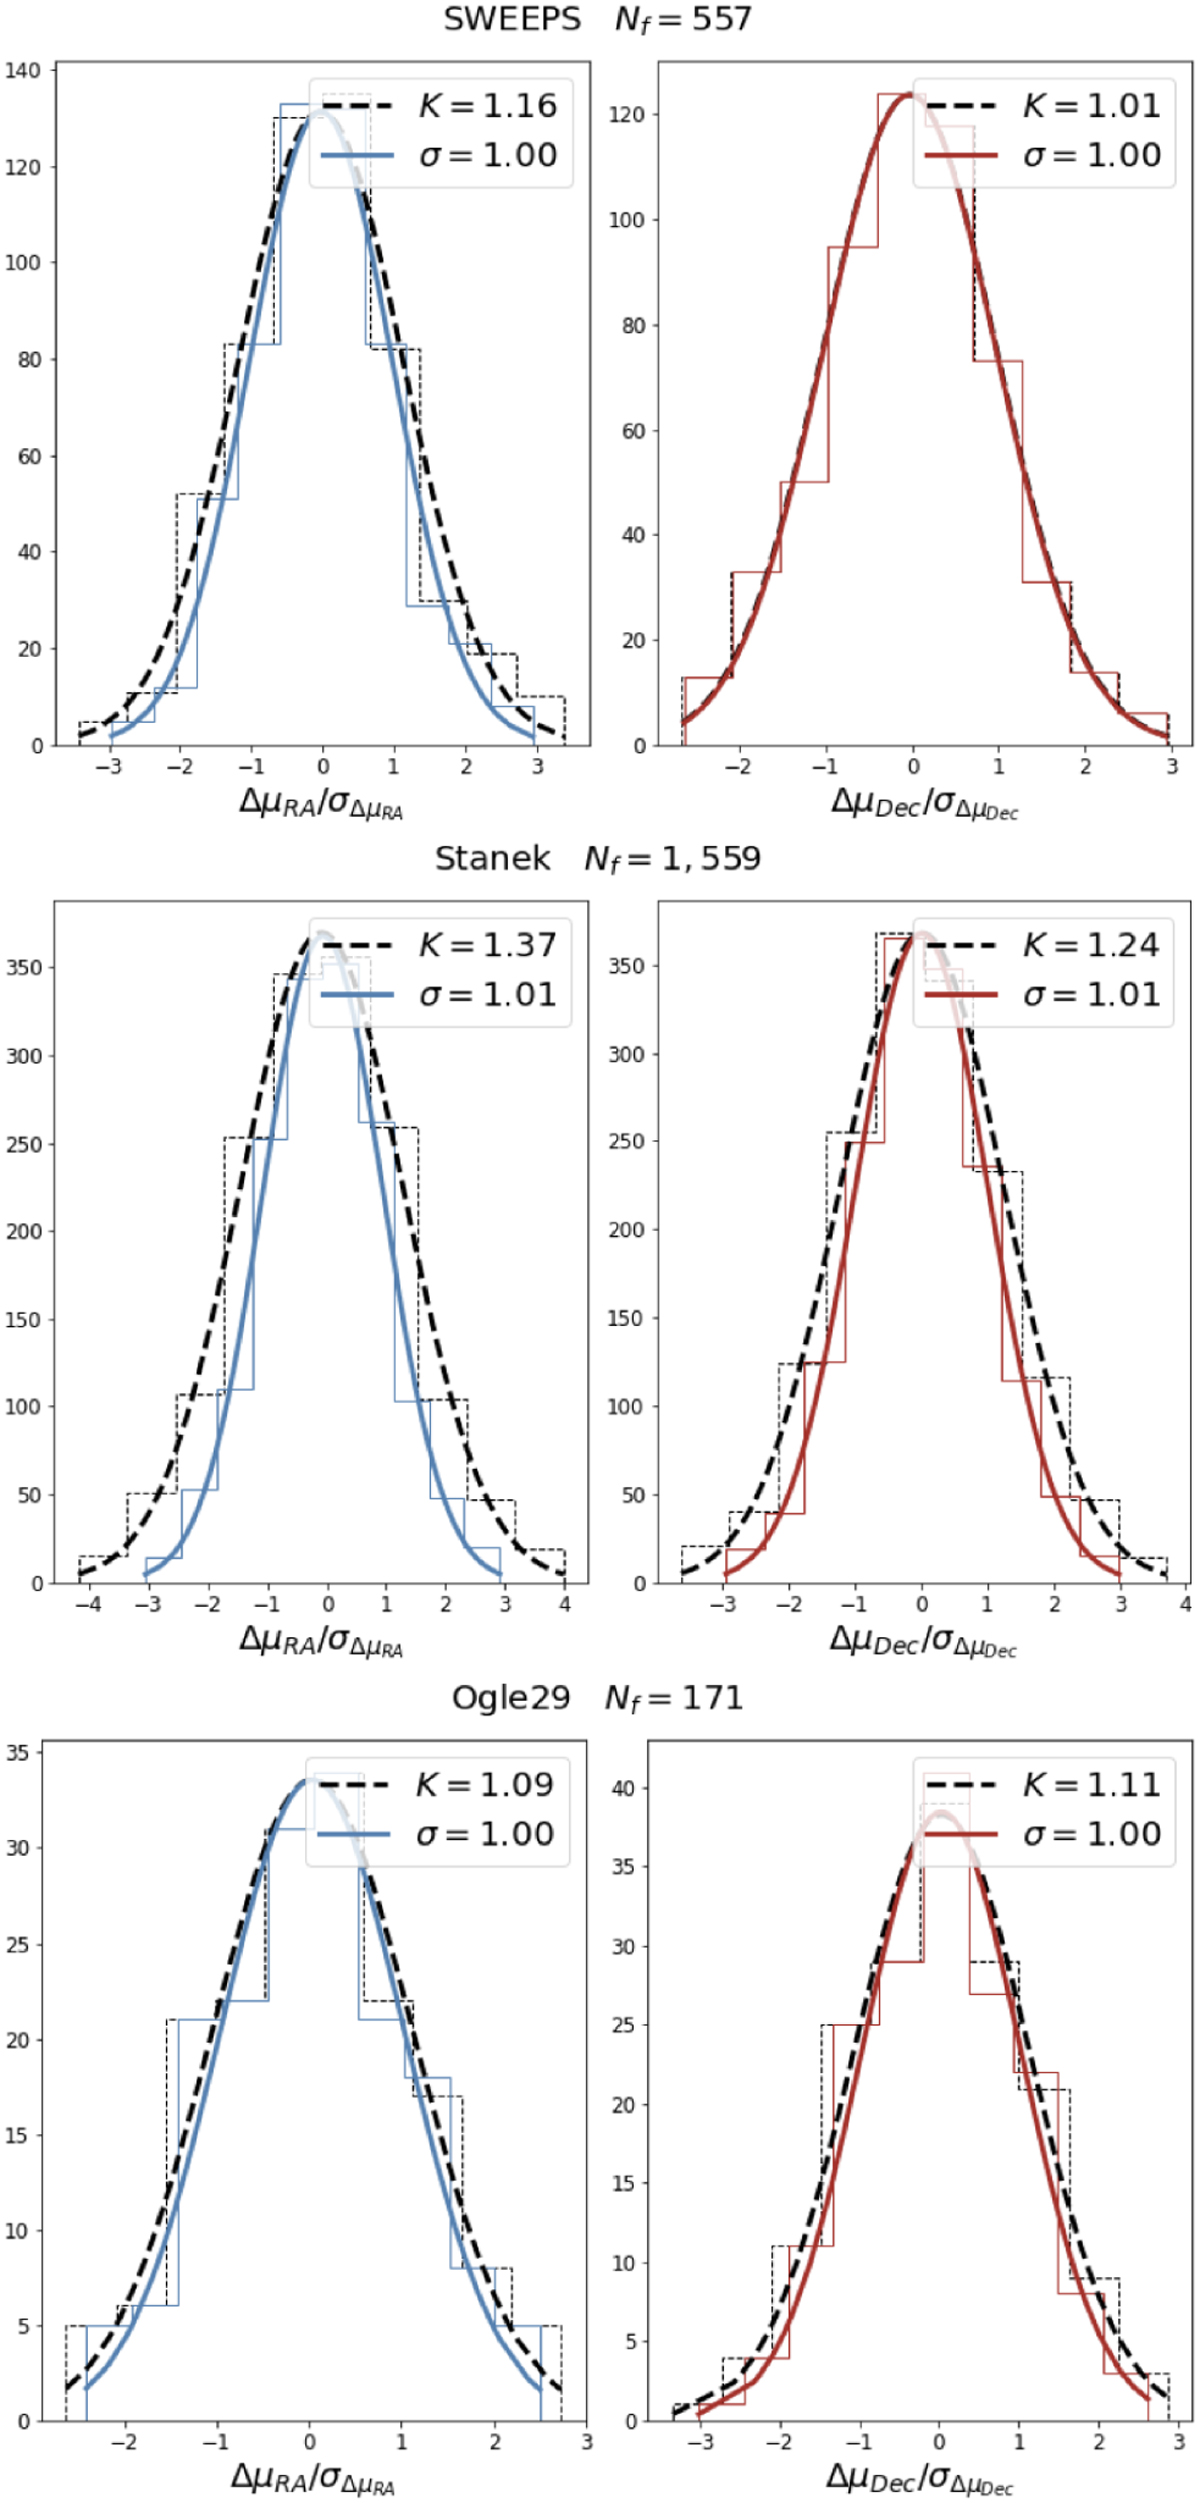
Normalised proper motion difference distribution for VIRAC2 vs. SWEEPS-BTP (top), VIRAC2 vs. Stanek-BTP (middle), and VIRAC2 vs. Ogle29-BTP (bottom). The dashed curves are the initial distributions in each coordinate component. The solid curves are the distributions after the VIRAC2 uncertainties are multiplied by the inflation factor r.
Current usage metrics show cumulative count of Article Views (full-text article views including HTML views, PDF and ePub downloads, according to the available data) and Abstracts Views on Vision4Press platform.
Data correspond to usage on the plateform after 2015. The current usage metrics is available 48-96 hours after online publication and is updated daily on week days.
Initial download of the metrics may take a while.