Fig. 5
Download original image
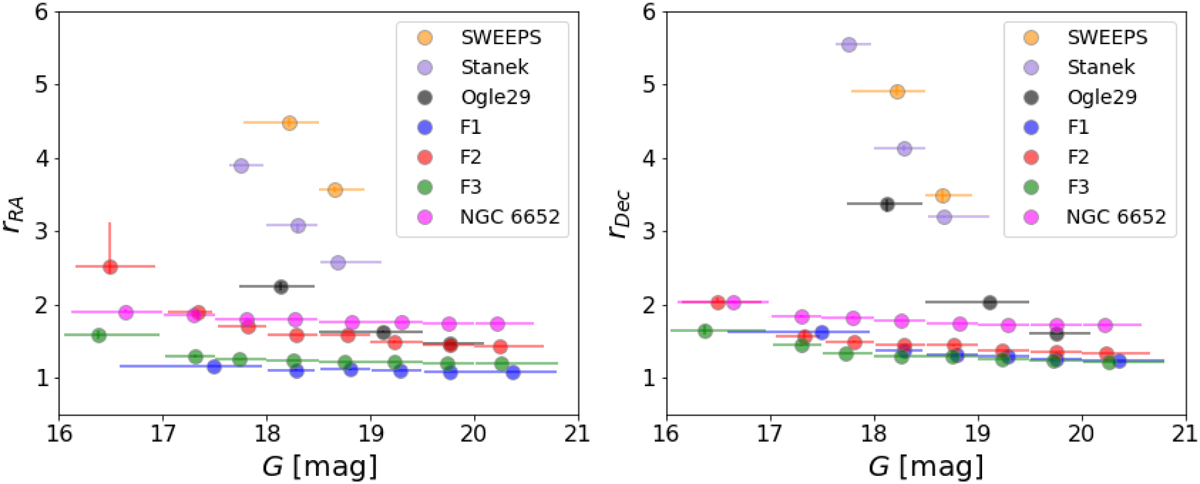
Dependence of the inflation factor r on the G-band magnitude of the studied HST fields. The points represent the medians of the magnitude bins, and for r, the error bars are the 16th and 84th percentiles. The bars in G indicate the magnitude distribution in a given bin, where the marker is the median. The plotted data are listed in Table 2.
Current usage metrics show cumulative count of Article Views (full-text article views including HTML views, PDF and ePub downloads, according to the available data) and Abstracts Views on Vision4Press platform.
Data correspond to usage on the plateform after 2015. The current usage metrics is available 48-96 hours after online publication and is updated daily on week days.
Initial download of the metrics may take a while.