Fig. 3
Download original image
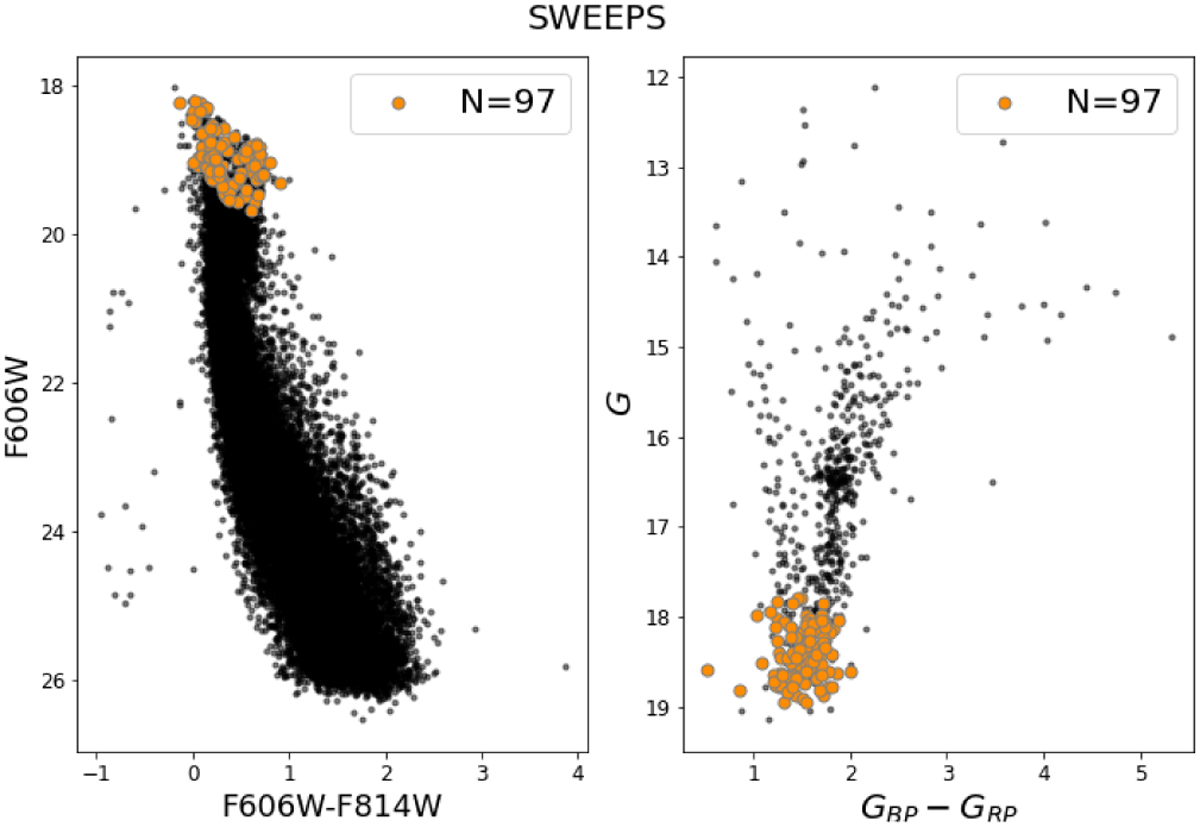
Colour-magnitude diagrams of Gaia DR3 and HST in the SWEEPS window. The orange points correspond to the location of the cross-matched sources after the quality cuts and a 3σ clipping in the uncertainty normalised proper motion difference. The black dots are the total sources in the field after the quality cuts. The two catalogues overlap in a short magnitude range.
Current usage metrics show cumulative count of Article Views (full-text article views including HTML views, PDF and ePub downloads, according to the available data) and Abstracts Views on Vision4Press platform.
Data correspond to usage on the plateform after 2015. The current usage metrics is available 48-96 hours after online publication and is updated daily on week days.
Initial download of the metrics may take a while.