Fig. 2
Download original image
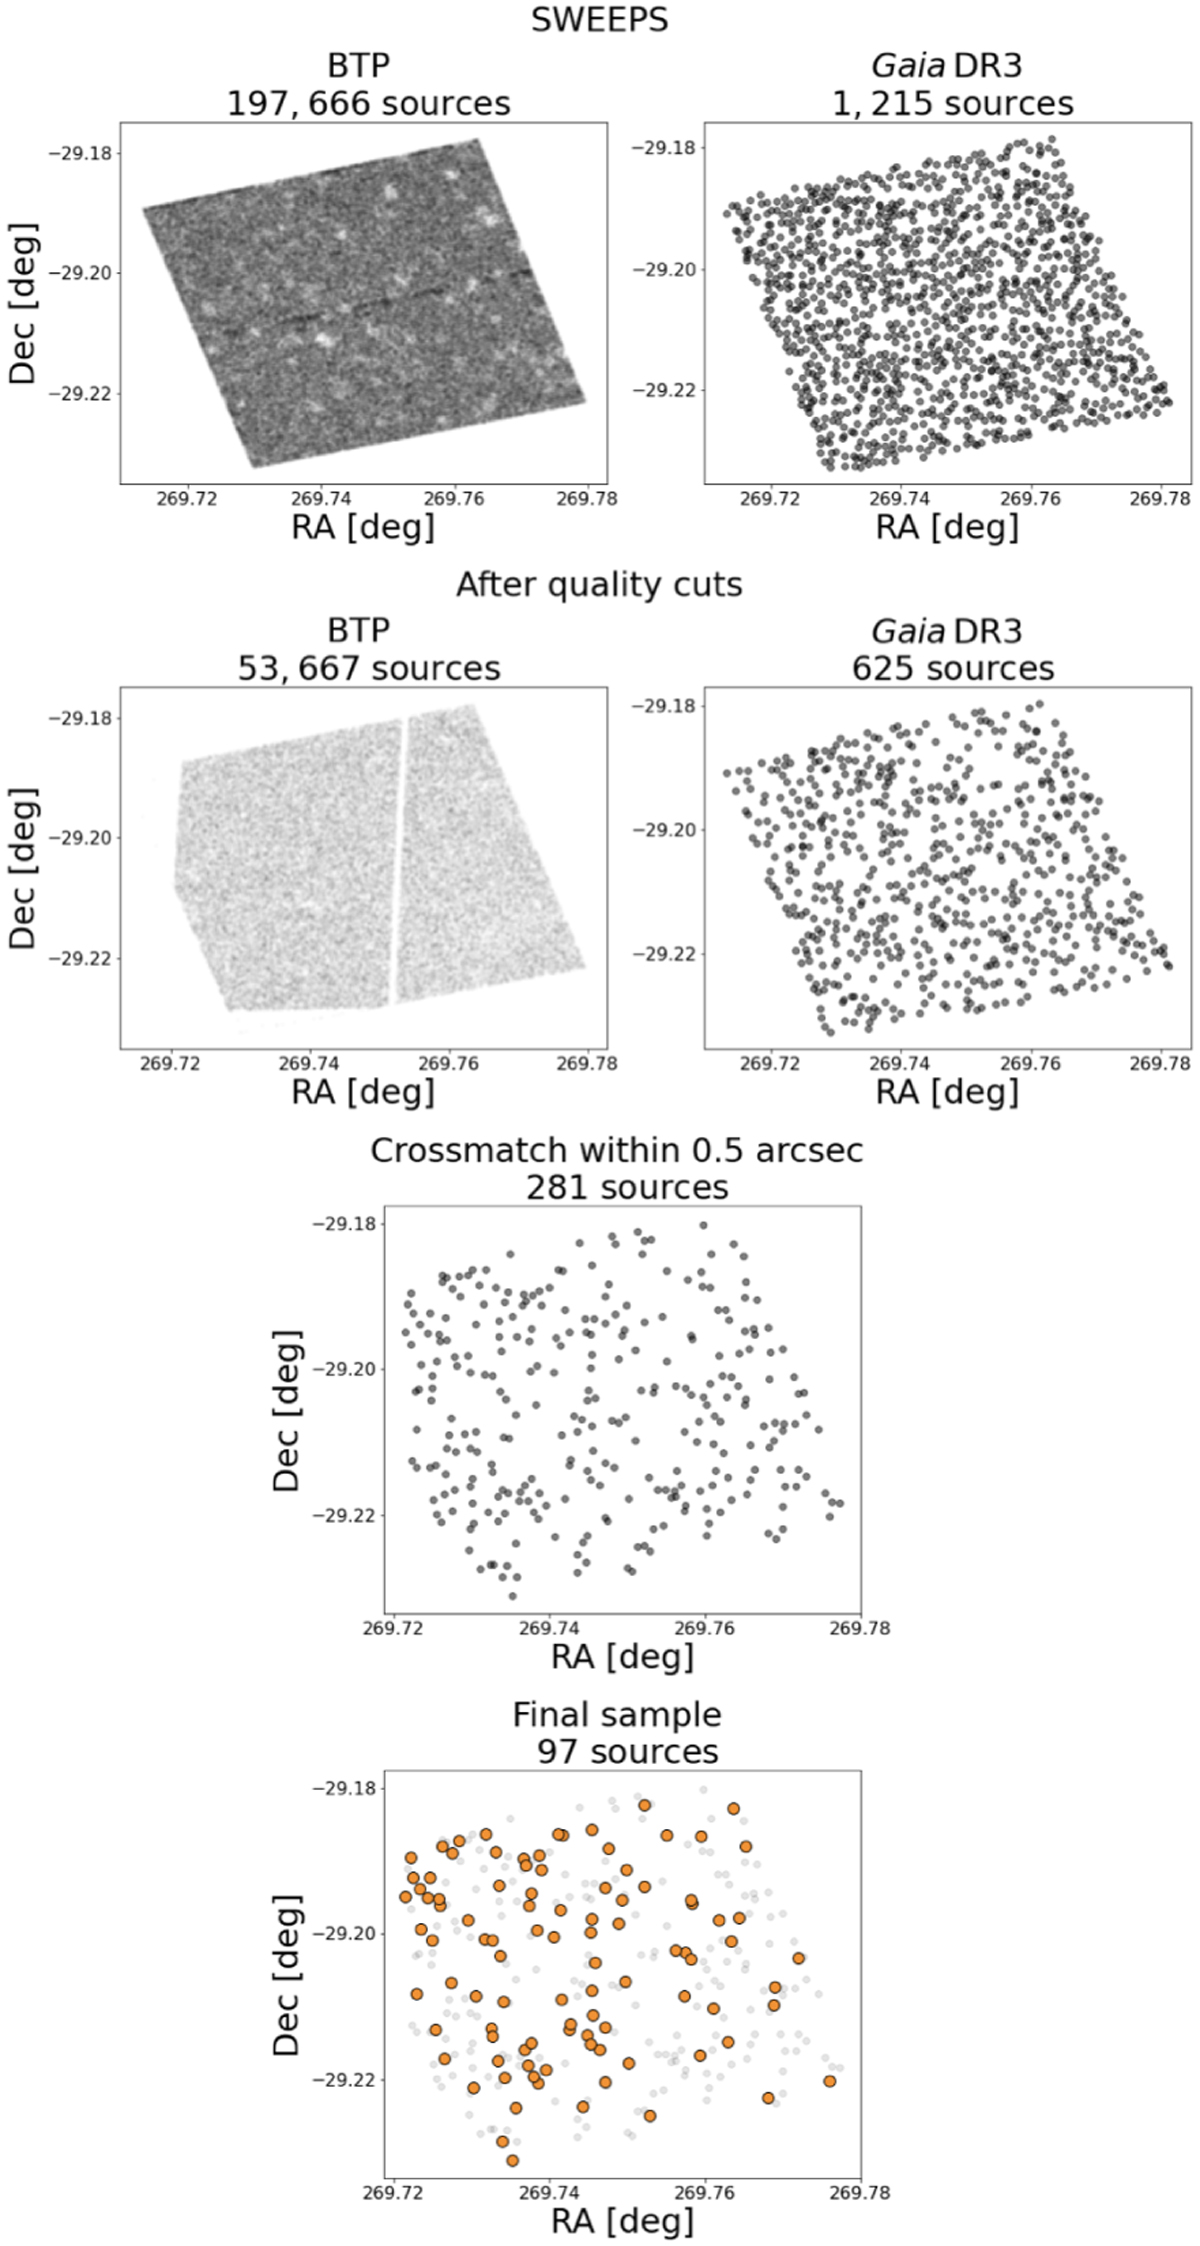
Number of sources in Gaia DR3 and HST-BTP in the SWEEPS field. From top to bottom: Initial sample in the same FoV after applying the quality cuts described in Sect. 2, after a cross match between the data sets with a tolerance of 0.″5, and the final sample used for the study. The position of the sources in the final sample is plotted in orange. In the second row, the lack of sources in the corners of the BTP data set arises because they did not have a proper motion value in the BTP catalogue. This is due to small differences in the field orientation between different epoch exposures.
Current usage metrics show cumulative count of Article Views (full-text article views including HTML views, PDF and ePub downloads, according to the available data) and Abstracts Views on Vision4Press platform.
Data correspond to usage on the plateform after 2015. The current usage metrics is available 48-96 hours after online publication and is updated daily on week days.
Initial download of the metrics may take a while.