Fig. 9.
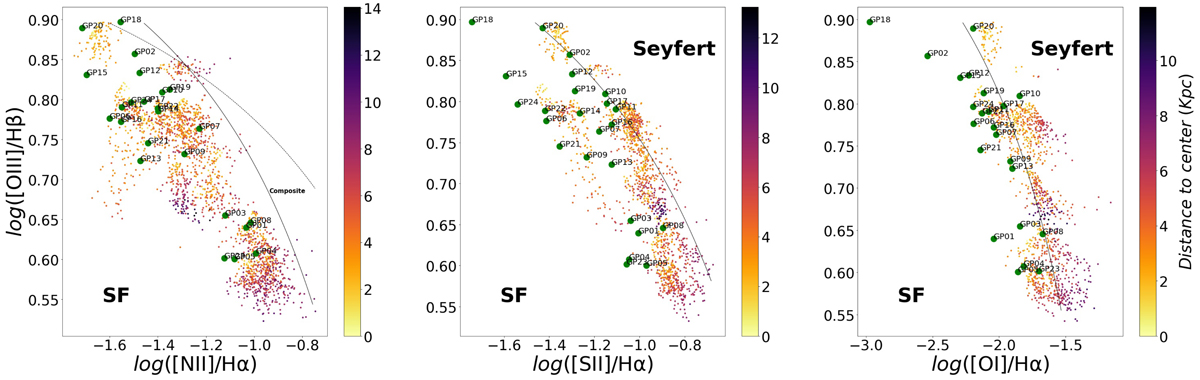
Download original image
BPT diagram. Small dots in the color scale (from yellow to dark purple) correspond to spaxels in each galaxy. Big green dots correspond to the integrated spectra of the galaxy. Next to the green dots we can see the name of each galaxy. The color of the small dots corresponds to the distance to the center of the galaxy. The closer to the center the more yellow they are, and farther away from the center they become darker. The lines that delimitate each region are taken from Kewley et al. (2001) and Kauffmann et al. (2003).
Current usage metrics show cumulative count of Article Views (full-text article views including HTML views, PDF and ePub downloads, according to the available data) and Abstracts Views on Vision4Press platform.
Data correspond to usage on the plateform after 2015. The current usage metrics is available 48-96 hours after online publication and is updated daily on week days.
Initial download of the metrics may take a while.