Fig. 8.
Download original image
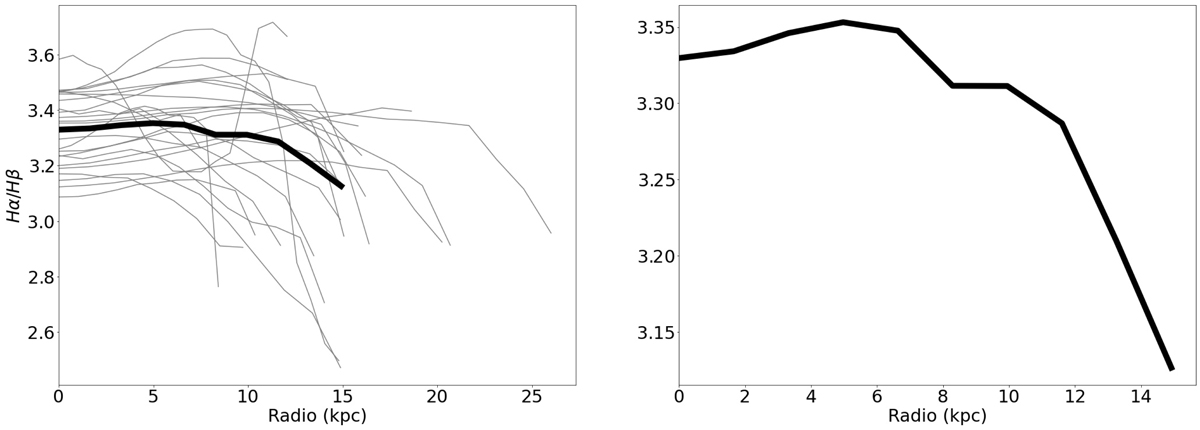
Radial profile of Hα/Hβ. The left image shows the profiles of all GPs with available information about the lines in gray. In black it is represented the mean of all galaxies and extends up to a radius where only 30% of the galaxies present values at larger radii. On the right is a zoomed-in image of the mean profile. The same display applies to all line ratios presented in the appendix.
Current usage metrics show cumulative count of Article Views (full-text article views including HTML views, PDF and ePub downloads, according to the available data) and Abstracts Views on Vision4Press platform.
Data correspond to usage on the plateform after 2015. The current usage metrics is available 48-96 hours after online publication and is updated daily on week days.
Initial download of the metrics may take a while.