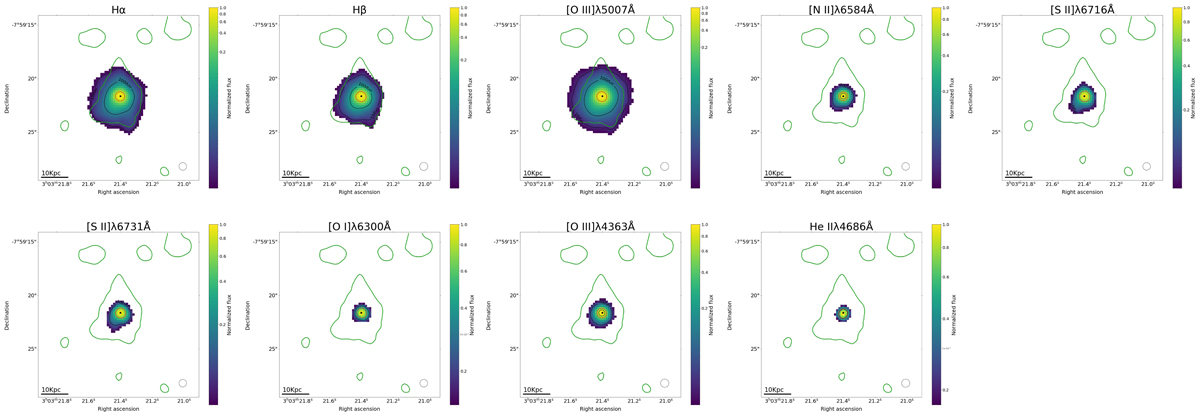
Fig. 2.
Download original image
GP06 emission line maps. The black line in the bottom left corresponds to a distance of 10 kpc. The circle in the bottom right is the representation of the seeing. The peak in the Hα emission is represented by the black point in the middle. The green and black contour represents the 3σsky level of the continuum map corresponding to the same galaxy. All maps presented in this work have the previously mentioned features except for the continuum maps, which do not present the continuum contour. Black contours are regions with different signal = k × σsky levels (with k = 10, 100), and all spaxels represented in all maps are above 3σsky. The red contour indicates the FWHM of the map. The same contours are shown in each emission line map and continuum map in this study.
Current usage metrics show cumulative count of Article Views (full-text article views including HTML views, PDF and ePub downloads, according to the available data) and Abstracts Views on Vision4Press platform.
Data correspond to usage on the plateform after 2015. The current usage metrics is available 48-96 hours after online publication and is updated daily on week days.
Initial download of the metrics may take a while.