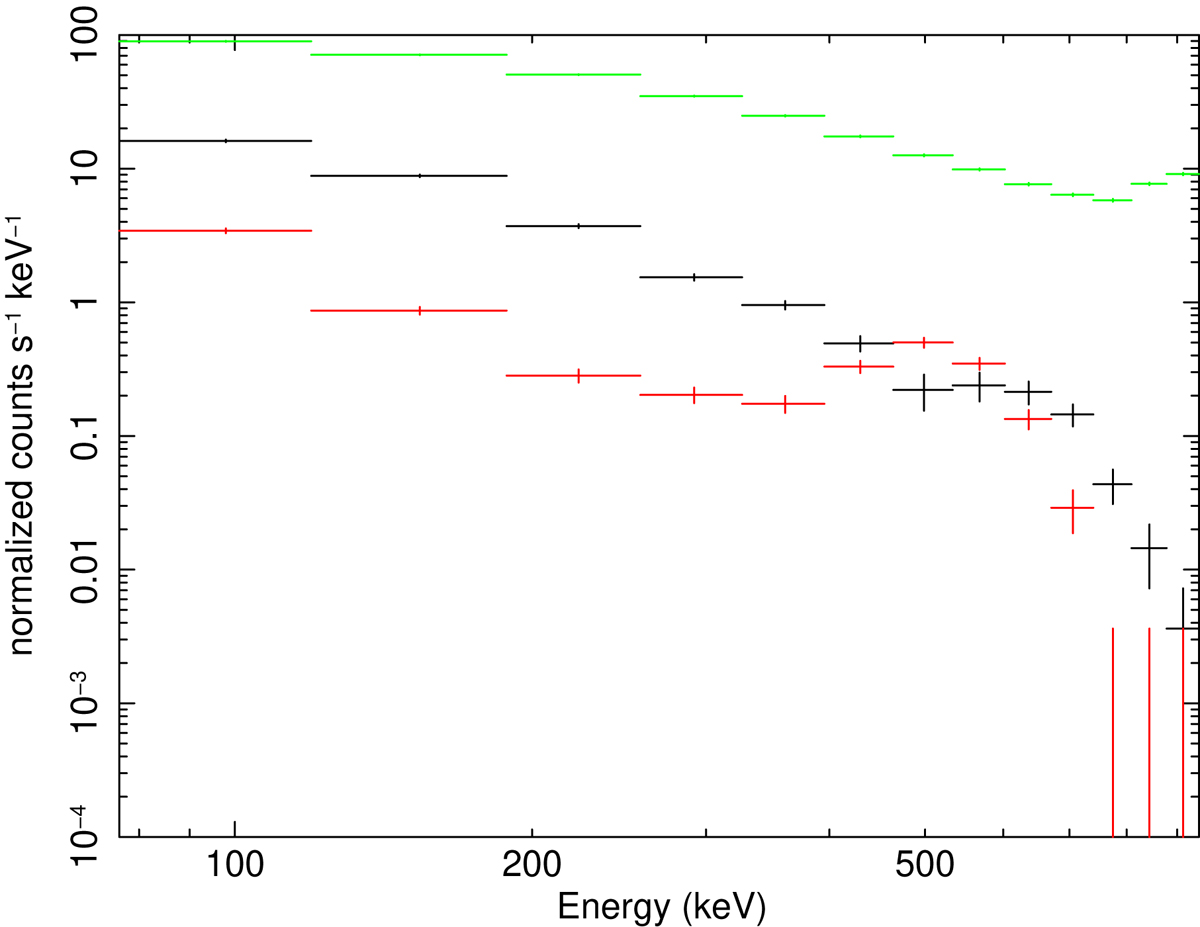
Fig. 5.
Download original image
Detected count spectra of GRB 221009A and the background spectrum. The count spectrum of the GRB at time ts minus the background spectrum at time tb is shown in black. The background spectrum at time tb is shown in red. The count spectrum of the GRB at the peak time tp = 13 : 20 : 49.5 UT on 2022 October 9, minus the background spectrum at time tb, is shown in green and it reveals a spectral hardening at the highest energies present around the GRB peak.
Current usage metrics show cumulative count of Article Views (full-text article views including HTML views, PDF and ePub downloads, according to the available data) and Abstracts Views on Vision4Press platform.
Data correspond to usage on the plateform after 2015. The current usage metrics is available 48-96 hours after online publication and is updated daily on week days.
Initial download of the metrics may take a while.