Fig. 4.
Download original image
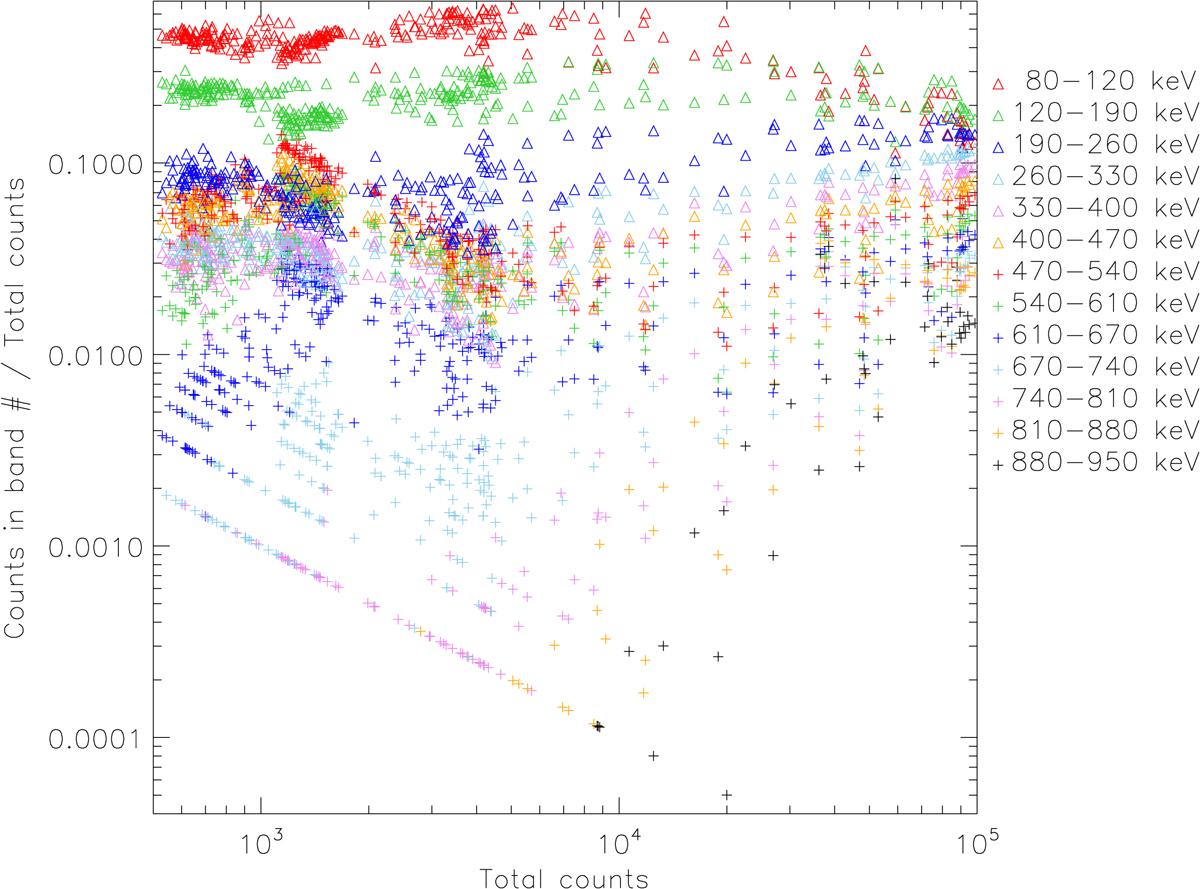
Fraction of the detected counts in each spectral band vs the total counts over the whole energy range for GRB 221009A and for the background as it passed the north polar region. The counts were detected in 4 s time bins. The figure shows that above ∼10 000 cnt bin = 2500 cnt s−1 the fraction of counts in low-energy bands decreases while the fraction of counts in high-energy bands increases, which can indicate a pile-up effect.
Current usage metrics show cumulative count of Article Views (full-text article views including HTML views, PDF and ePub downloads, according to the available data) and Abstracts Views on Vision4Press platform.
Data correspond to usage on the plateform after 2015. The current usage metrics is available 48-96 hours after online publication and is updated daily on week days.
Initial download of the metrics may take a while.