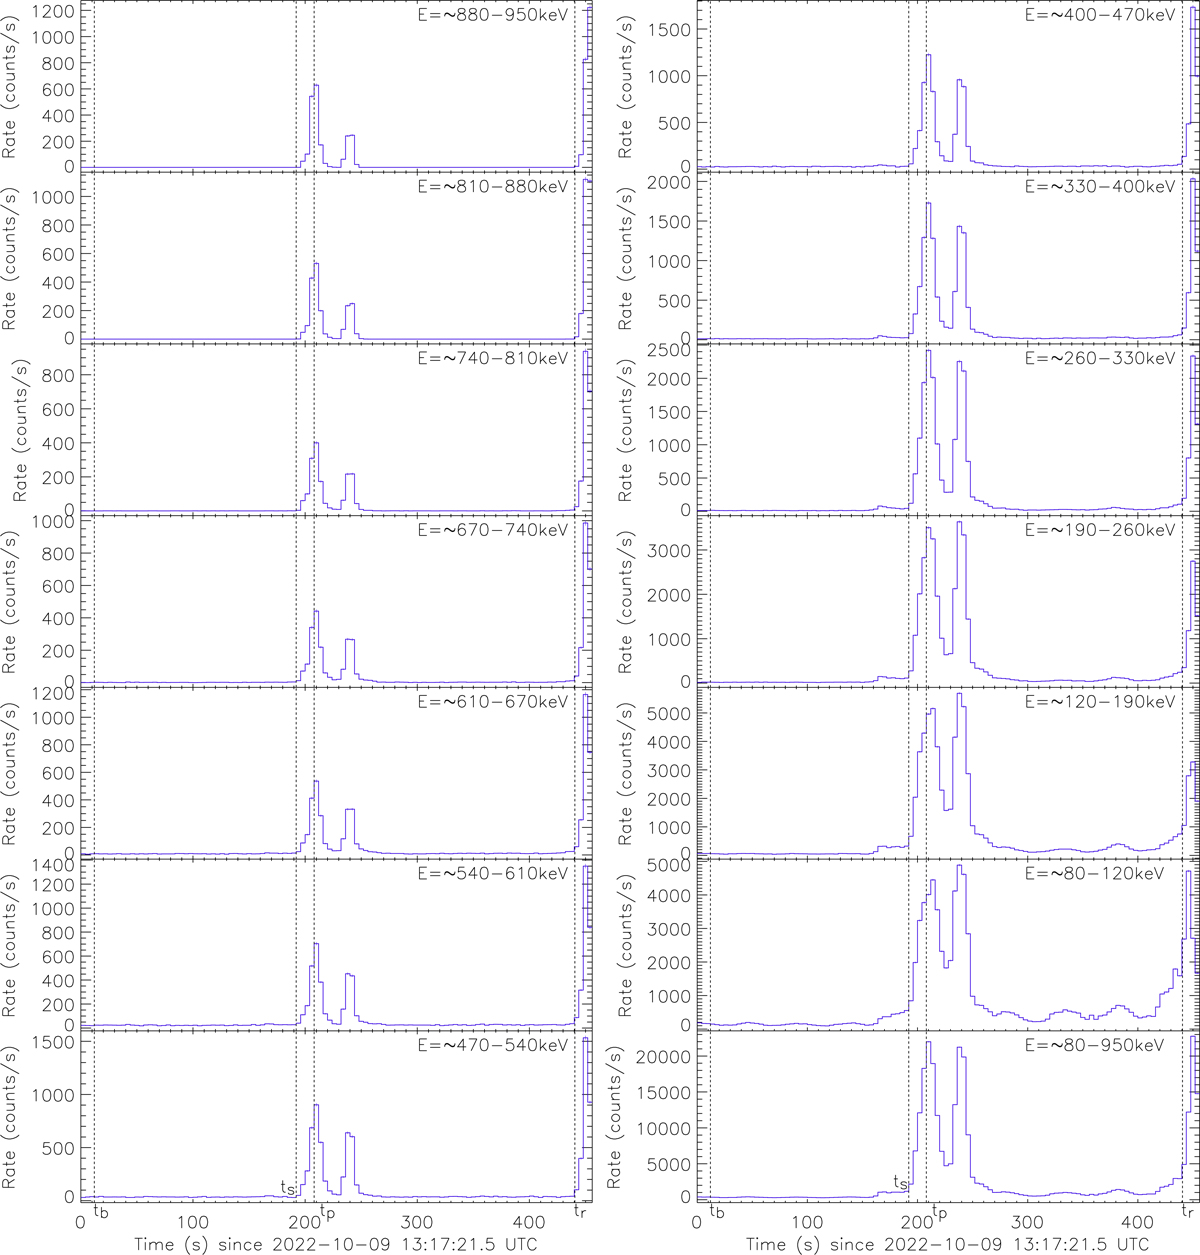
Fig. 1.
Download original image
Raw light curve of GRB 221009A as observed by GRBAlpha in multiple energy bands with 4 s cadence. The bottom-rightmost panel shows the light curve in the whole sensitivity range. Times tb, ts, and tp mark the beginning of the used background interval, the source spectral data, and the peak time, respectively. About 30 s after the peak at tp, the GRB shows a second strong peak. Time tr marks the approximate moment when the satellite entered the outer Van Allen radiation belt, which resulted in the final part of the GRB prompt emission being flooded by the particle background. The sharp increase just after tr is due to this background.
Current usage metrics show cumulative count of Article Views (full-text article views including HTML views, PDF and ePub downloads, according to the available data) and Abstracts Views on Vision4Press platform.
Data correspond to usage on the plateform after 2015. The current usage metrics is available 48-96 hours after online publication and is updated daily on week days.
Initial download of the metrics may take a while.