Fig. 7
Download original image
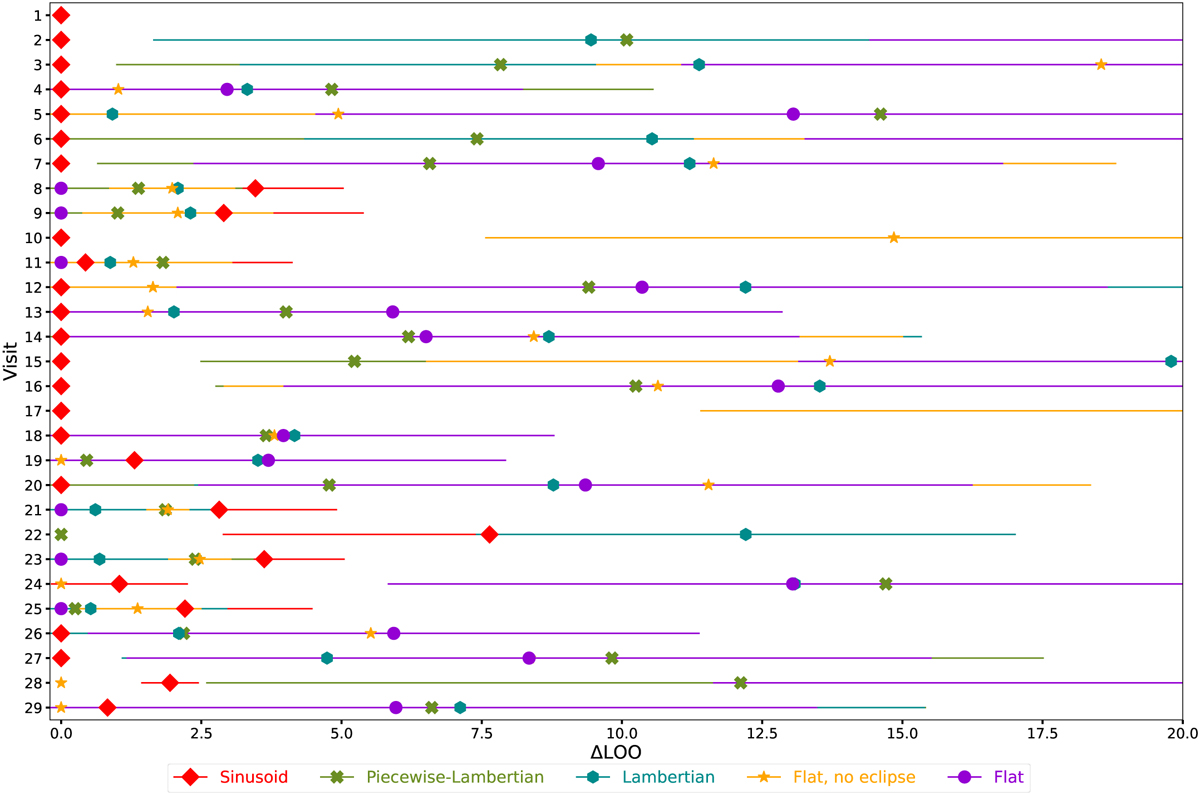
Model comparison based on the LOO criterion. The best-ranked model has a ∆LOO of zero. The x-axis shows the difference in the LOO for the models considered in each visit (y-axis). The error bars represent the standard error of the difference in the expected log-predictive density between each model and the top-ranked model. By definition, the standard error of the top-ranked model is zero. In visit 1, the ∆LOO to the second-ranked model is above 50 and thus is not visible in the plot. The red diamond represents a sinusoidal phase curve, the green cross is the piecewise-Lambertian model, the cyan hexagon is the Lambertian sphere, the orange star is a flat baseline without an eclipse, and the violet circle is a flat baseline with the eclipse as a free parameter.
Current usage metrics show cumulative count of Article Views (full-text article views including HTML views, PDF and ePub downloads, according to the available data) and Abstracts Views on Vision4Press platform.
Data correspond to usage on the plateform after 2015. The current usage metrics is available 48-96 hours after online publication and is updated daily on week days.
Initial download of the metrics may take a while.