Fig. 7
Download original image
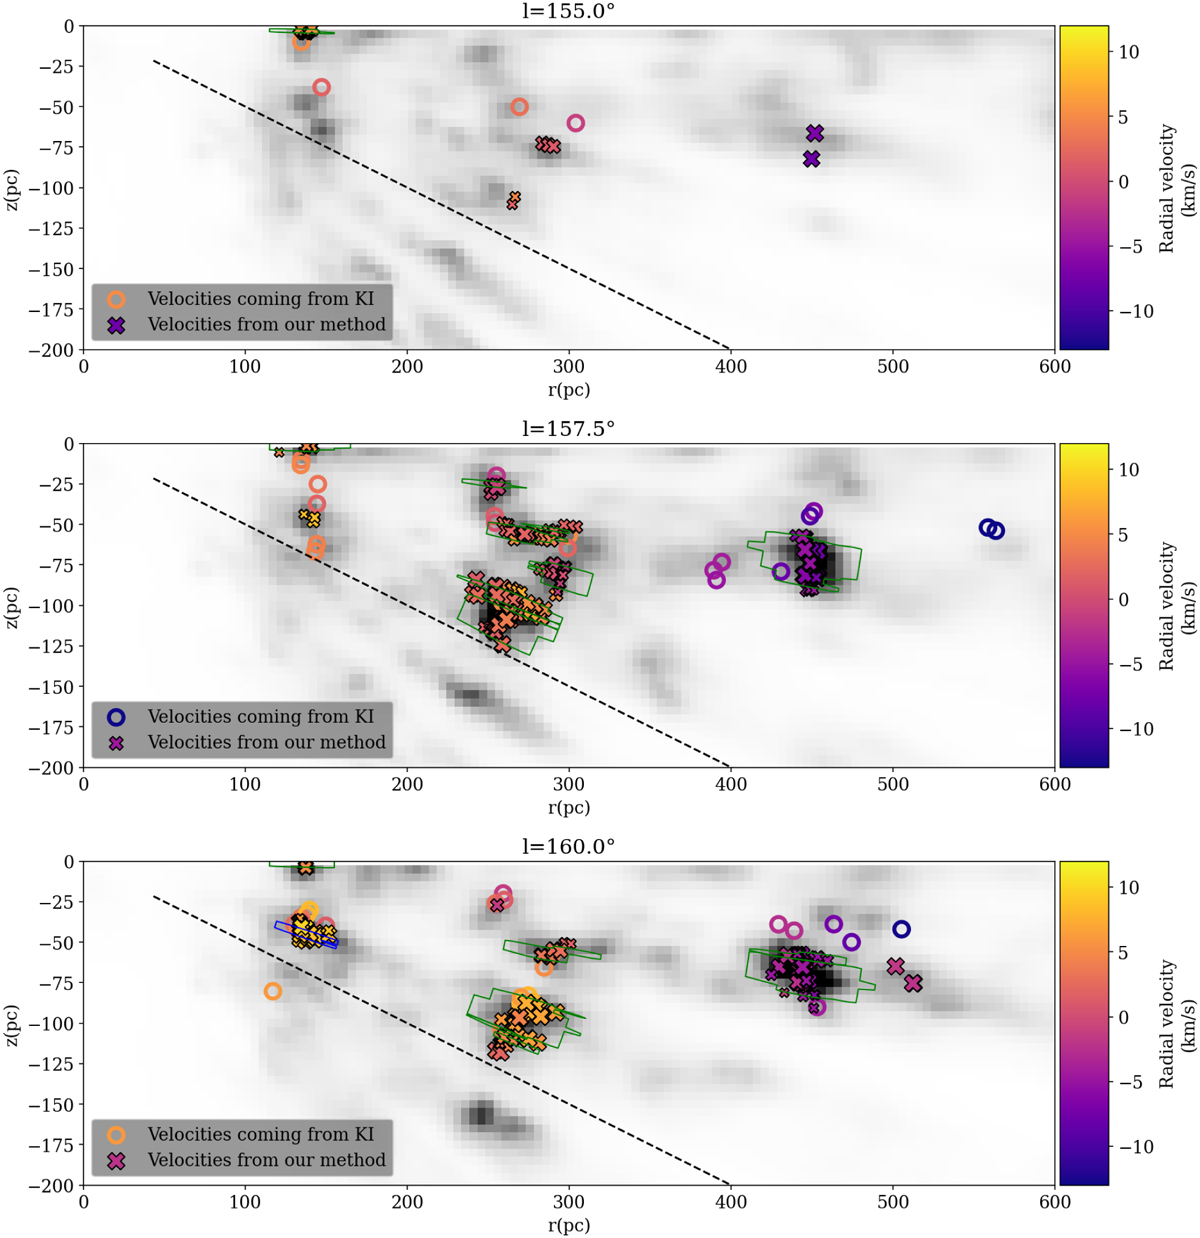
Comparison between radial velocities assigned to clouds with our method (marked with crosses) and those derived from KI spectra and attributed by Ivanova et al. (2021) to dust structures located in the same region of 3D space (marked with circles). We show the results in vertical planes containing the Sun and oriented toward the longitude 1 indicated at the top of the figures. As in Paper I, all data points in the interval [l − 1.25°, l + 1.25°] are treated as if they were contained in the 1 plane. The extinction density map at the given longitude is shown in grayscale. Our points are positioned at the barycenter of the clumps in the considered lines of sight, and the mean velocities are reported via the color bar. Points based on interstellar KI and initially manually located by Ivanova et al. (2021) close to the assigned clouds are kept at the same positions. In blue are the contours of the Fellwalker clumps in the given slice that have an assigned velocity and show the presence product lower than 0.375, and in green are the ones with a presence product of greater than 0.375, while non-assigned clumps are in black. The dotted line marks the b = −28° limit of the CO emission spectral cube. In a given clump, the sampling is every 1.0° in b and 0.125° in l. Empty crosses are used where the Fellwalker clump is only 1 voxel deep, which means it is not possible to calculate a barycenter.
Current usage metrics show cumulative count of Article Views (full-text article views including HTML views, PDF and ePub downloads, according to the available data) and Abstracts Views on Vision4Press platform.
Data correspond to usage on the plateform after 2015. The current usage metrics is available 48-96 hours after online publication and is updated daily on week days.
Initial download of the metrics may take a while.