Fig. 4
Download original image
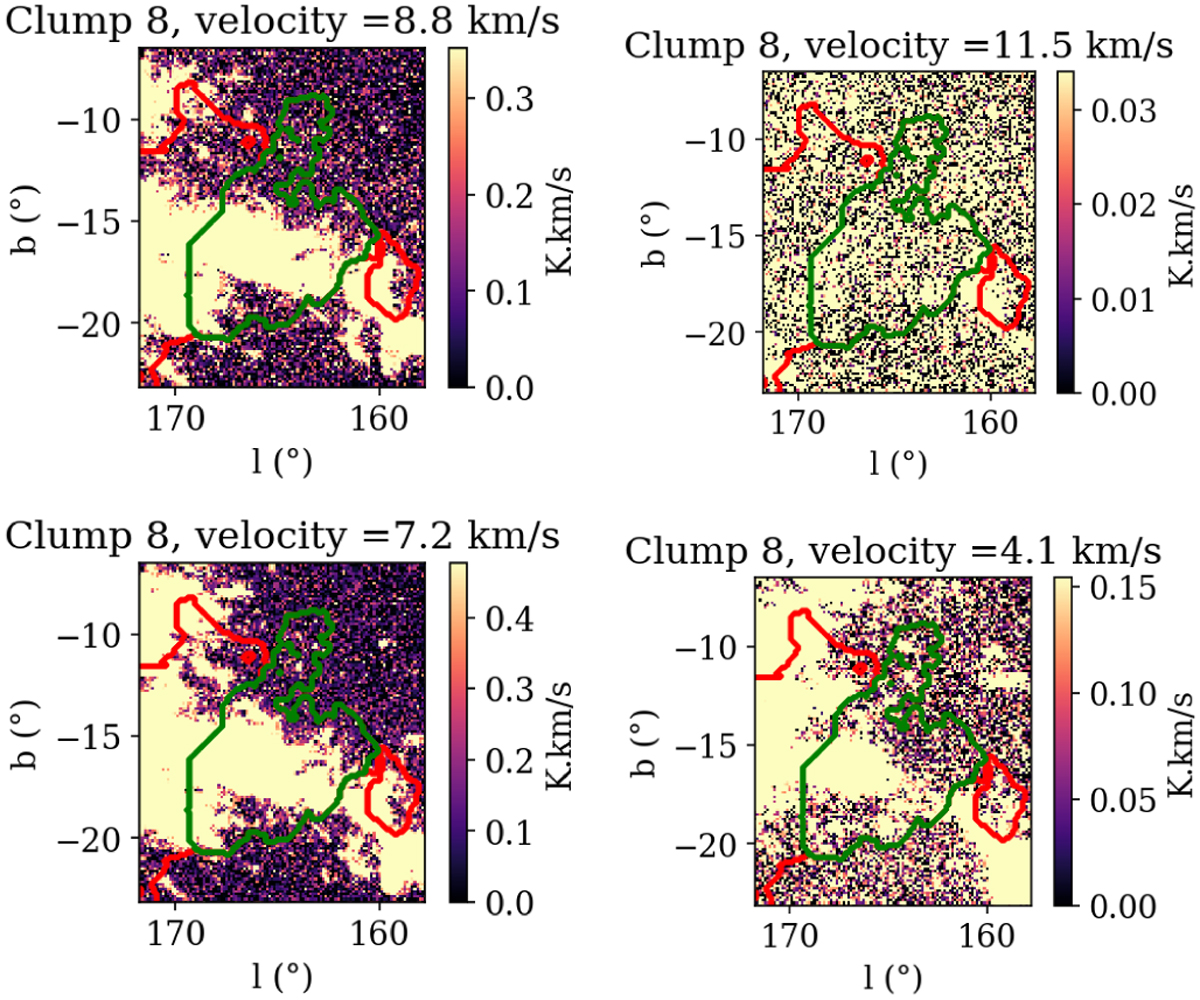
Integrated emission between the velocity bounds of each Gaussian component (central velocity ± the standard deviation) for clump 8 (central velocities 8.8, 11.5, 7.2 and 4.1 km s−1 respectively). The yellow upper limit of the color scale corresponds to the emission level at which the component is considered to be present in the line of sight. The CC clump contours are shown in green and the contours of the neighboring clouds constituting EC are shown in red.
Current usage metrics show cumulative count of Article Views (full-text article views including HTML views, PDF and ePub downloads, according to the available data) and Abstracts Views on Vision4Press platform.
Data correspond to usage on the plateform after 2015. The current usage metrics is available 48-96 hours after online publication and is updated daily on week days.
Initial download of the metrics may take a while.