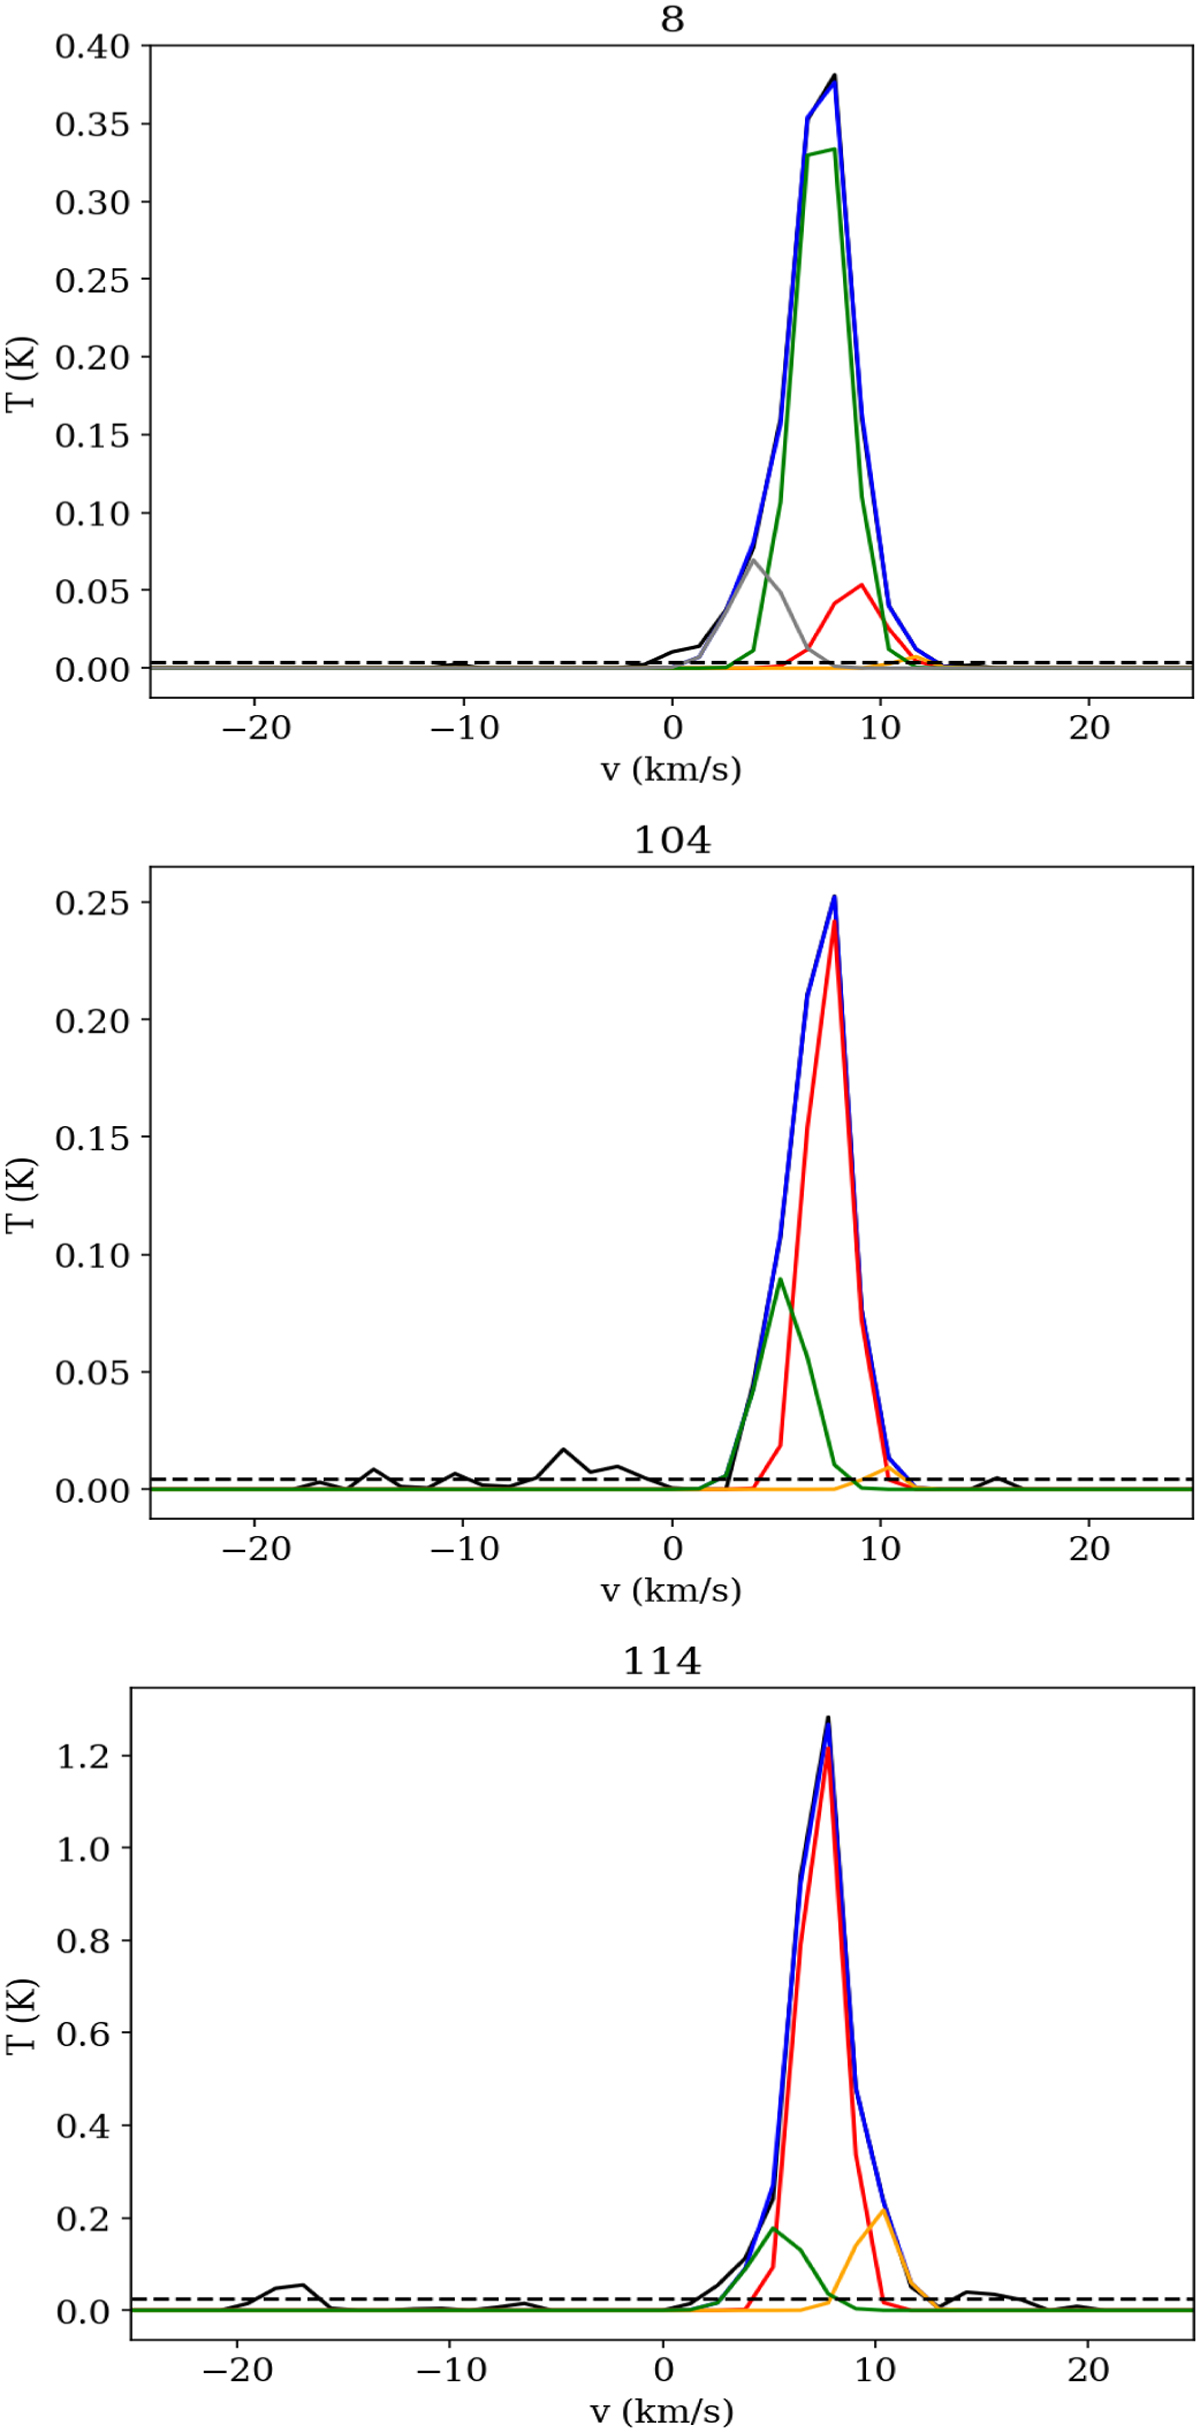
Fig. 3
Download original image
Median emission profiles integrated within the projected contours of three clumps, numbered 8, 104, and 114 (black curves), and their fit with a multi-Gaussian function (blue curves). Individual Gaussian components of the function are also detailed in red, orange, green, and gray. The noise level of the profile is indicated by a dashed horizontal line. Clump 114 has a smaller angular size than the two others, which explains its higher noise level.
Current usage metrics show cumulative count of Article Views (full-text article views including HTML views, PDF and ePub downloads, according to the available data) and Abstracts Views on Vision4Press platform.
Data correspond to usage on the plateform after 2015. The current usage metrics is available 48-96 hours after online publication and is updated daily on week days.
Initial download of the metrics may take a while.