Fig. 2
Download original image
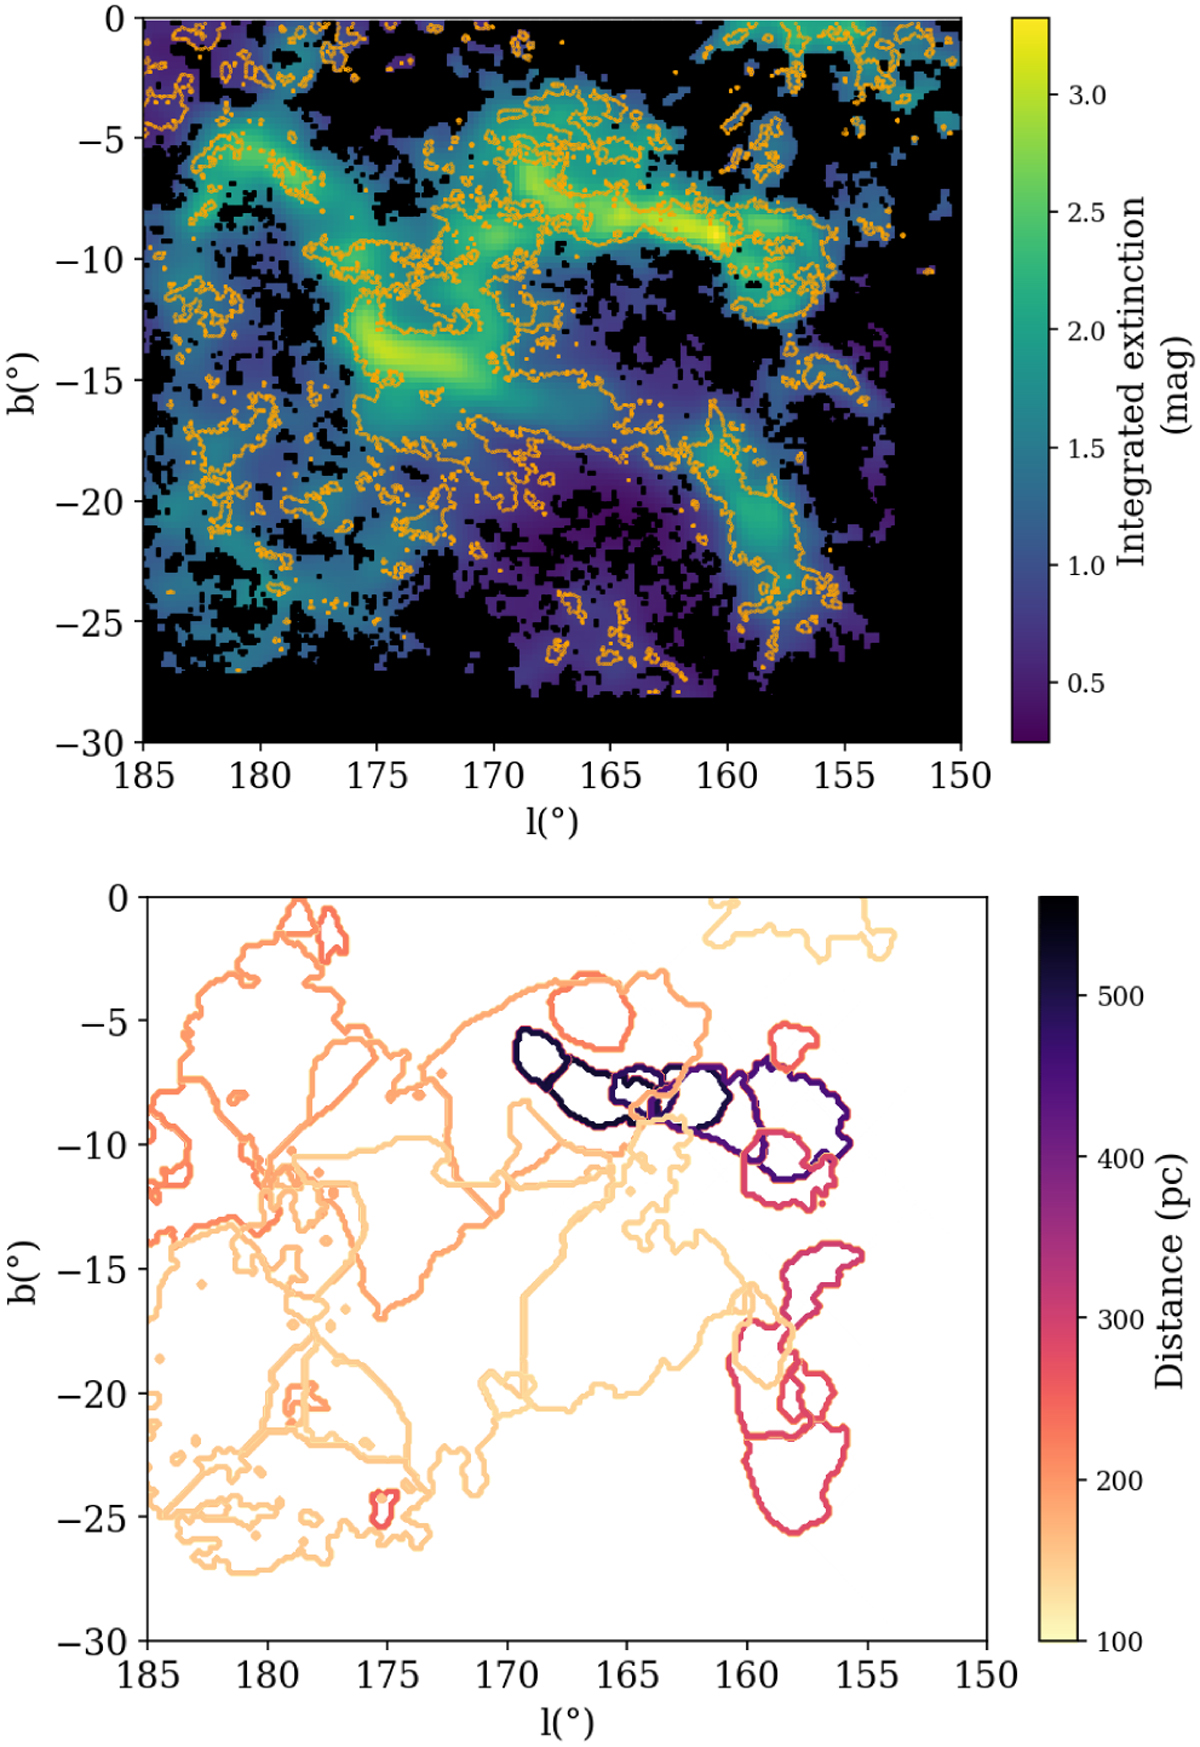
Restriction mask and clump obtained. Top: restriction mask determined from the CO spectra (see Sect. 3.1) and applied to the 3D extinction map before its Fellwalker decomposition step. Masked areas are in black and superimposed on an image of the cumulative extinction integrated between 0 and 1 kpc within the inverted 3D extinction density distribution. The yellow contour corresponds to an integrated CO intensity of 0.11 K.km s−1. The unmasked areas encompass all regions where CO is present,includingareas of very weak intensityclose to the measurement uncertainty level, except very close to the Galactic Plane due to the limited size of the 3D map (see text). Bottom: projection in the same area of the discrete extinction clouds issued from the Fellwalker decomposition. Cloud contours are colored according to their mean distance from the Sun (right scale).
Current usage metrics show cumulative count of Article Views (full-text article views including HTML views, PDF and ePub downloads, according to the available data) and Abstracts Views on Vision4Press platform.
Data correspond to usage on the plateform after 2015. The current usage metrics is available 48-96 hours after online publication and is updated daily on week days.
Initial download of the metrics may take a while.