Fig. 14
Download original image
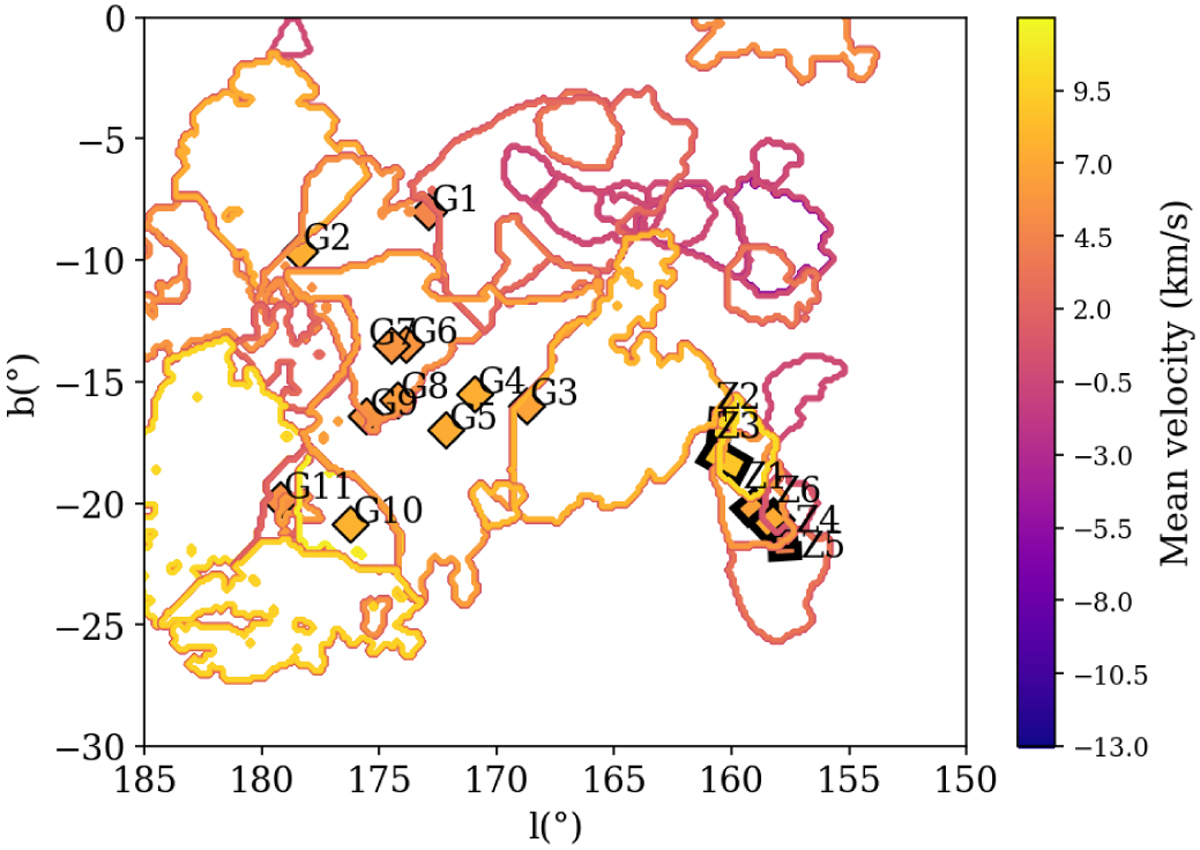
Projection of clump contours, colored according to their assigned mean velocity (right scale). The map is in Galactic coordinates. The results of Zucker et al. (2018) and Galli et al. (2019) are superimposed as markers at their average direction and with the same color scale for their peak-reddening velocities. The areas investigated by Zucker et al. (2018) are designated using a Zx annotation, while the points of Galli et al. (2019) are marked out by aGx.
Current usage metrics show cumulative count of Article Views (full-text article views including HTML views, PDF and ePub downloads, according to the available data) and Abstracts Views on Vision4Press platform.
Data correspond to usage on the plateform after 2015. The current usage metrics is available 48-96 hours after online publication and is updated daily on week days.
Initial download of the metrics may take a while.