Fig. 1
Download original image
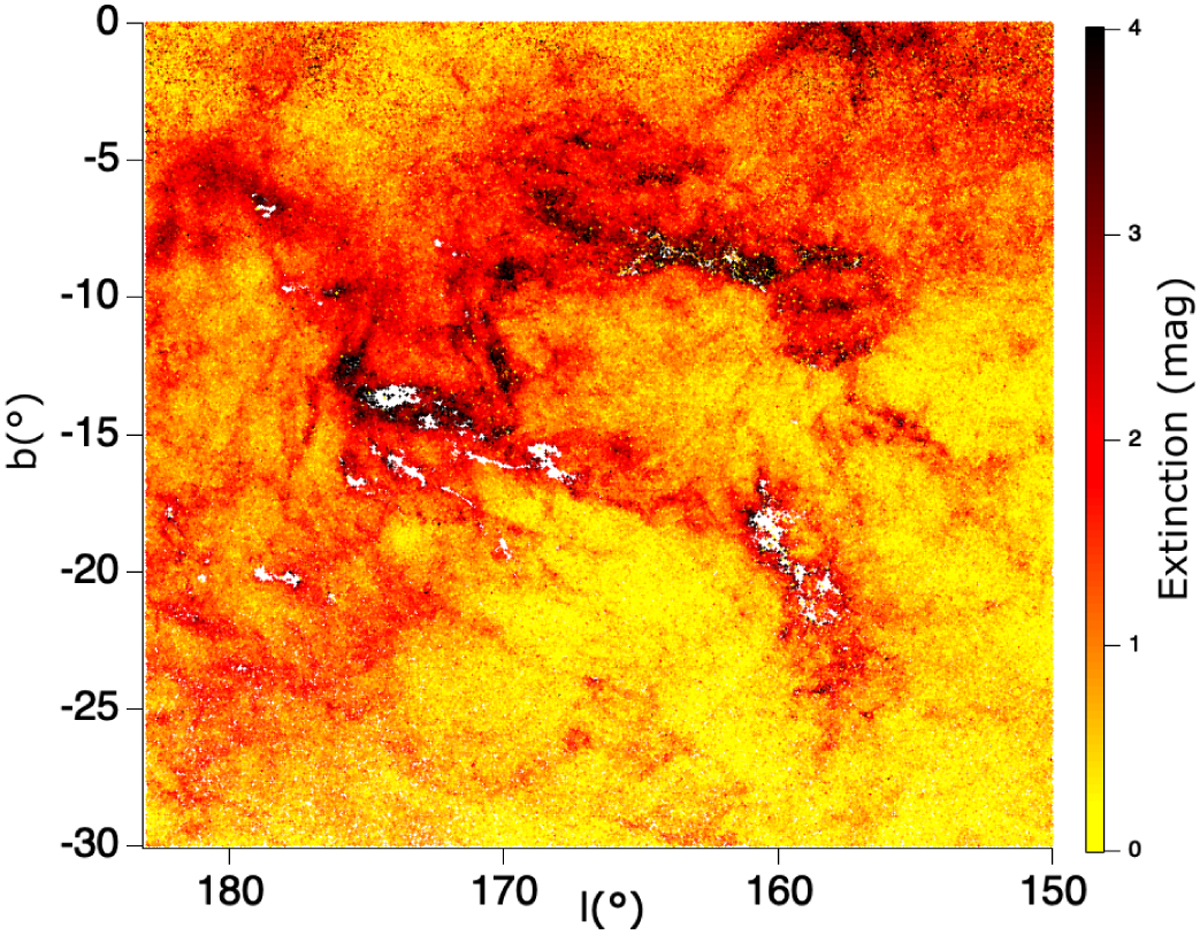
Target stars used to build the 3D extinction density map in the Taurus area. The locations of the stars are shown as dots colored according to their extinction (color scale to the right of the figure). White areas correspond to high-opacity central regions within the main dust clouds (extinctions above ≃4 to 5 mag) and mark the subsequent lack of targets with precise distances and photometry due to their faintness. The reconstructed dust distribution will reproduce the clouds but underestimate the corresponding high opacity of the cores.
Current usage metrics show cumulative count of Article Views (full-text article views including HTML views, PDF and ePub downloads, according to the available data) and Abstracts Views on Vision4Press platform.
Data correspond to usage on the plateform after 2015. The current usage metrics is available 48-96 hours after online publication and is updated daily on week days.
Initial download of the metrics may take a while.