Fig. 3.
Download original image
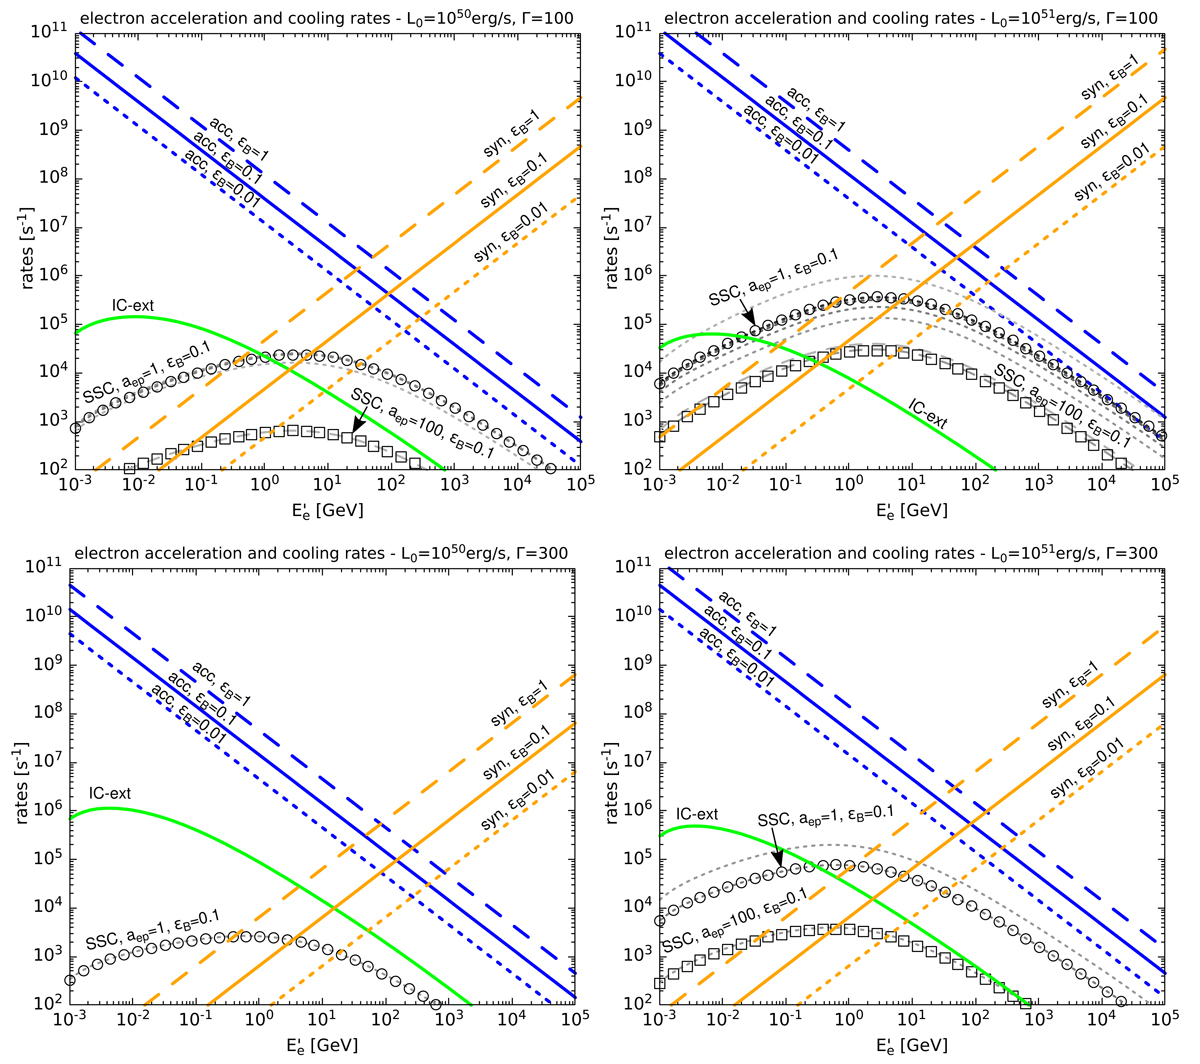
Cooling and acceleration rates for electrons at the internal shocks of CGRBs for L0 = 1050 erg s−1 and L0 = 1051 erg s−1 in the left and right panels, respectively. Top panels correspond to Γ = 100 and the bottom ones to Γ = 300. The different processes are indicated with the following curves: Dashed lines are for ϵB = 1, solid lines for ϵB = 0.1, and short-dashed lines for ϵB = 0.01. The blue curves refer to acceleration, orange ones to synchrotron, and green ones to external IC. The circles refer to SSC with (aep = 1, ϵB = 0.1) and squares to SSC with (aep = 100, ϵB = 0.1). With dashed gray lines, we also show the auxiliary results used to obtain the SSC rate with the iterative method mentioned in the text.
Current usage metrics show cumulative count of Article Views (full-text article views including HTML views, PDF and ePub downloads, according to the available data) and Abstracts Views on Vision4Press platform.
Data correspond to usage on the plateform after 2015. The current usage metrics is available 48-96 hours after online publication and is updated daily on week days.
Initial download of the metrics may take a while.