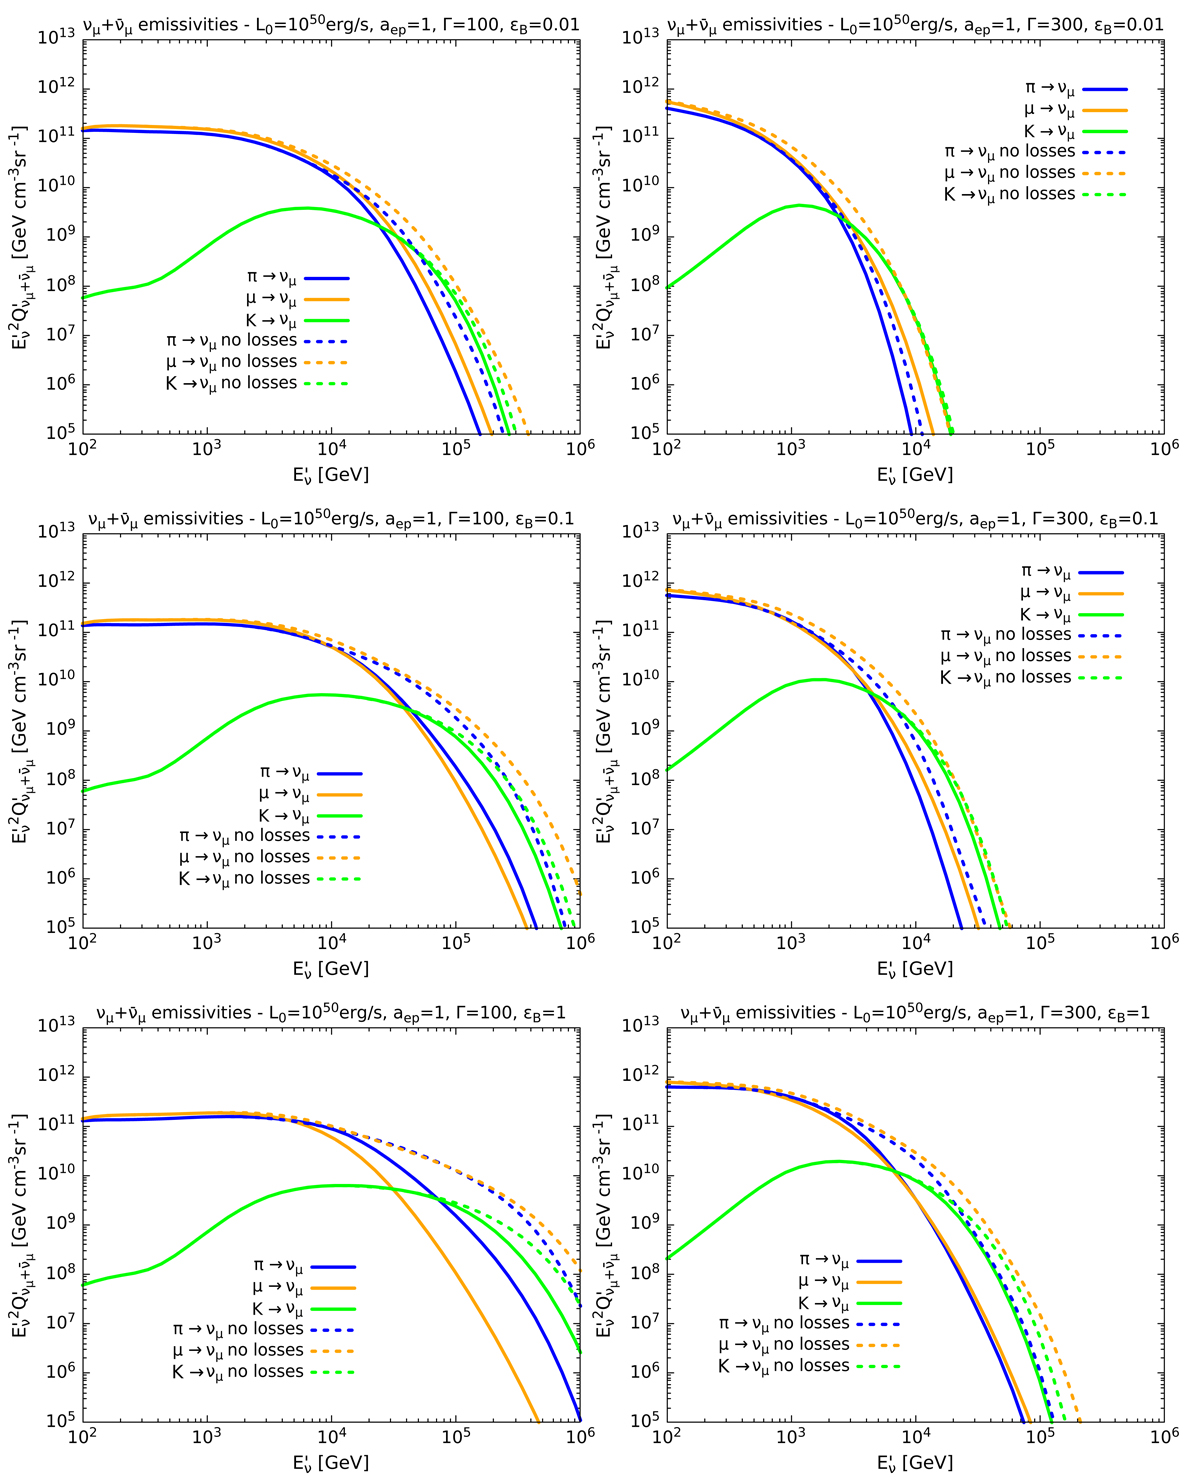
Fig. 12.
Download original image
Emissivities of muon neutrinos and antineutrinos from the decay of pions (blue curves), muons (orange curves), and kaons (green curves) for L0 = 1050 erg s−1. The dashed curves represent the obtained output if all losses of the parent particles are neglected, while the solid curves mark the results if all the losses discussed are considered. The left plots correspond to aep = 1 and the right plots to aep = 100.
Current usage metrics show cumulative count of Article Views (full-text article views including HTML views, PDF and ePub downloads, according to the available data) and Abstracts Views on Vision4Press platform.
Data correspond to usage on the plateform after 2015. The current usage metrics is available 48-96 hours after online publication and is updated daily on week days.
Initial download of the metrics may take a while.