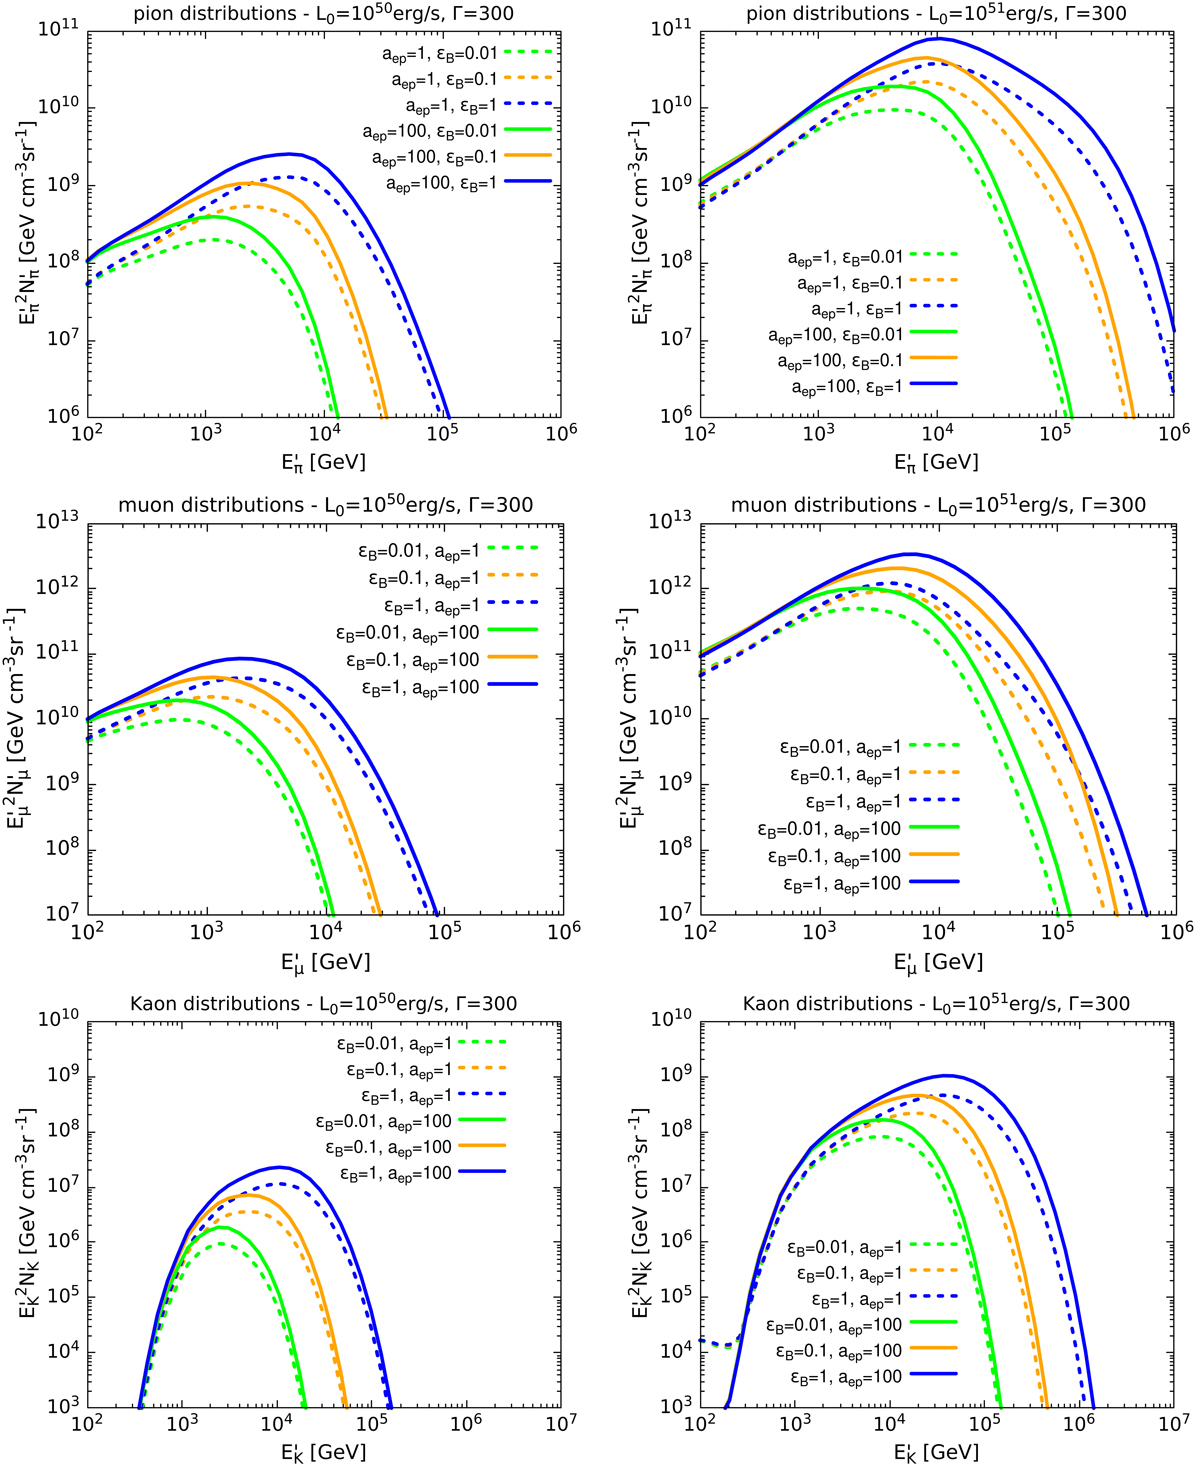
Fig. 11.
Download original image
Distributions of pions (top), muons (middle), and charged kaons (bottom) for Γ = 300. The left plots correspond to L0 = 1050 erg s−1 and the right plots to L0 = 1051 erg s−1. The green, orange, and blue curves refer to the cases of ϵB = 0.01, ϵB = 0.1, and ϵB = 1, respectively. The dashed curves correspond to aep = 1 and the solid ones to aep = 100.
Current usage metrics show cumulative count of Article Views (full-text article views including HTML views, PDF and ePub downloads, according to the available data) and Abstracts Views on Vision4Press platform.
Data correspond to usage on the plateform after 2015. The current usage metrics is available 48-96 hours after online publication and is updated daily on week days.
Initial download of the metrics may take a while.