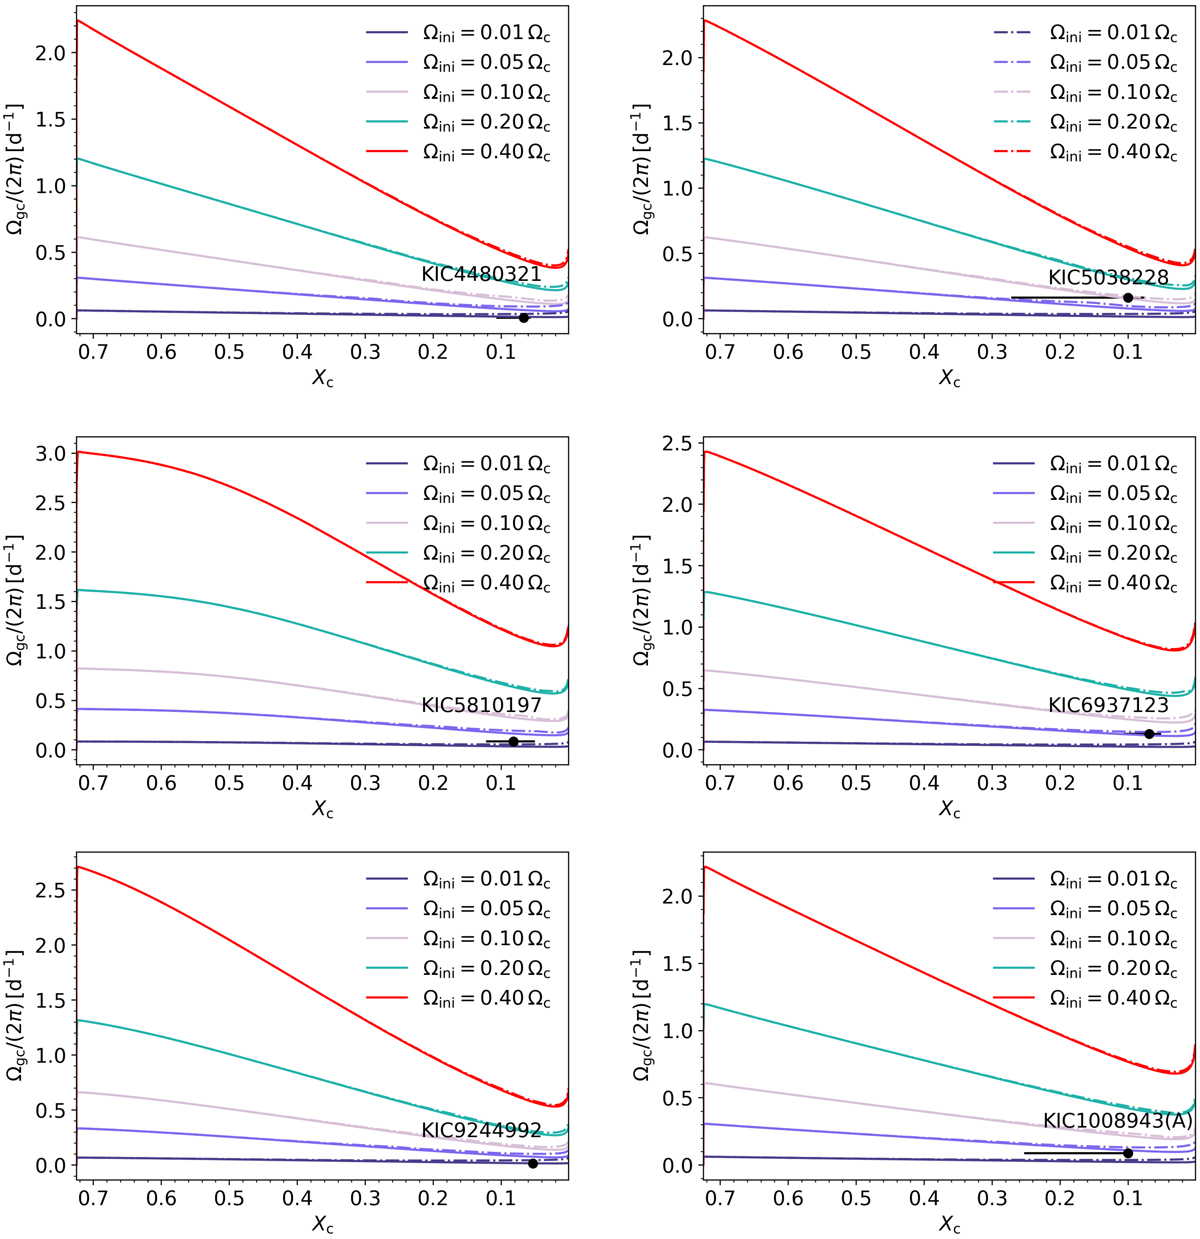
Fig. 9.
Download original image
Predicted evolution of the g-mode cavity rotation frequency as a function of the hydrogen-mass fraction in the core for different initial rotation frequencies as a fraction of the initial Keplerian critical break-up frequency. In each panel, the stellar mass and fov correspond to those in the best-matching model listed in Table 2. The black markers indicate the observations, where the Xc estimate is from this work, and the rotation frequency is from Li et al. (2019, uncertainties on Ωgc smaller than symbol size). The solid lines are models with a constant uniform viscosity (Sect. 3.1), whereas the dashed-dotted lines are the models with rotational instabilities (Sect. 3.2).
Current usage metrics show cumulative count of Article Views (full-text article views including HTML views, PDF and ePub downloads, according to the available data) and Abstracts Views on Vision4Press platform.
Data correspond to usage on the plateform after 2015. The current usage metrics is available 48-96 hours after online publication and is updated daily on week days.
Initial download of the metrics may take a while.