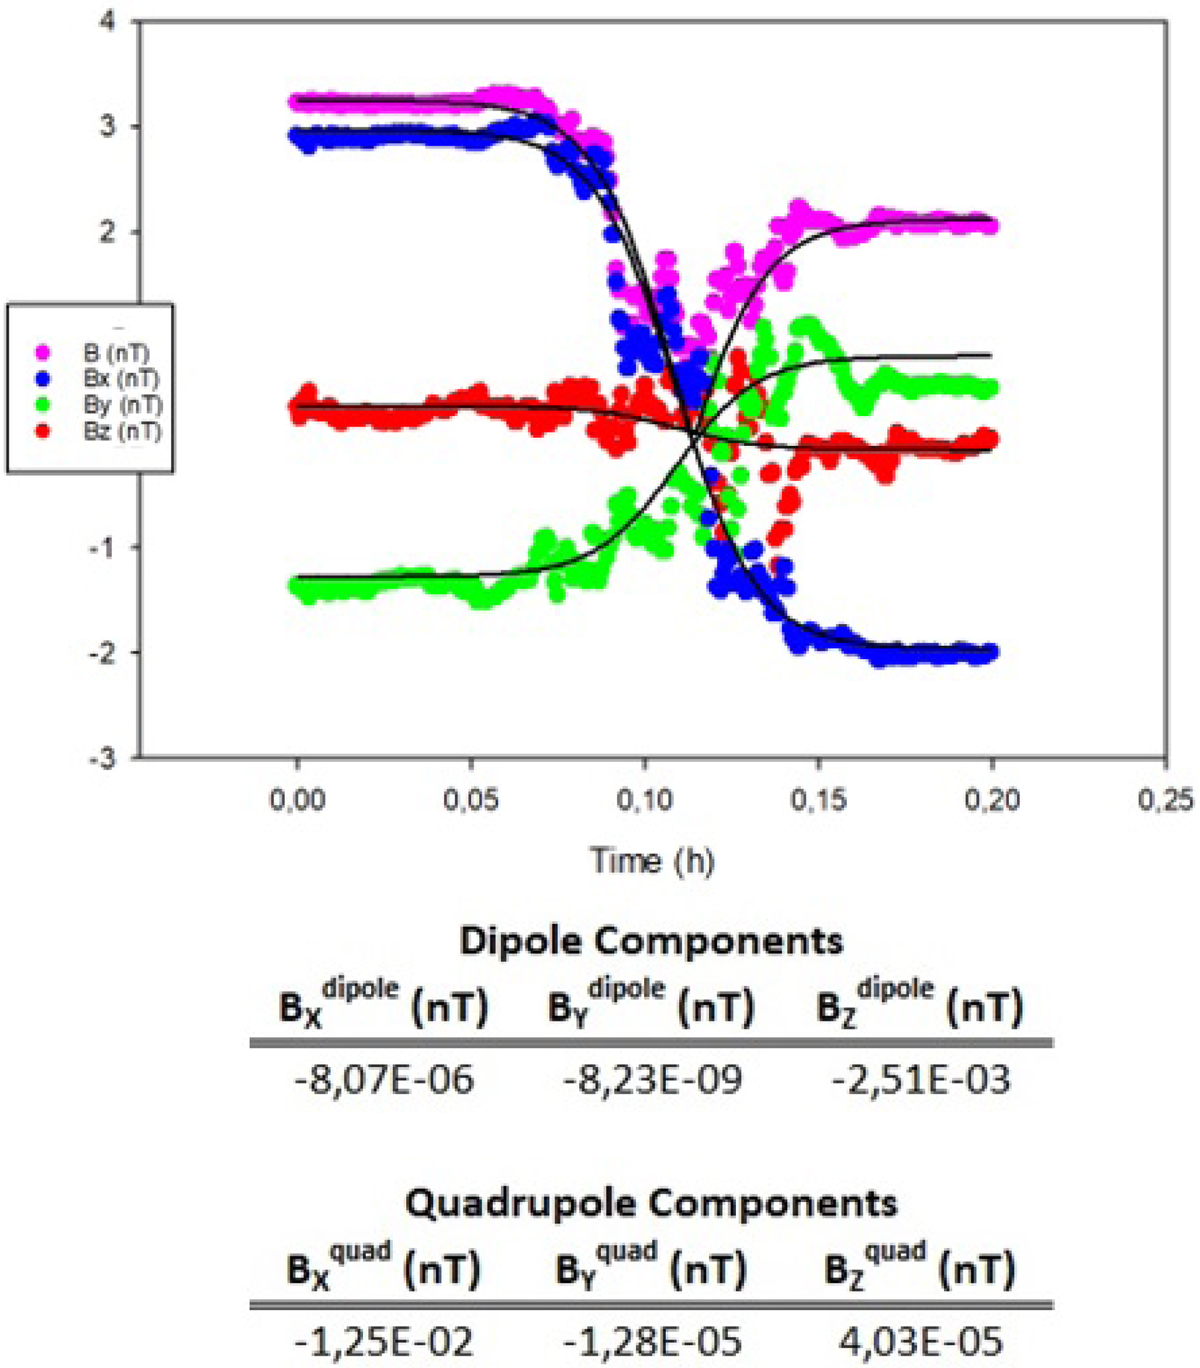
Fig. 4.
Download original image
WIND spacecraft observation of a CS crossing on April 17, 2006. The background magnetic field is decomposed in the dipolar and quadrupolar components in GSE coordinates and the results of them are presented in this figure. In figure, dots represent the magnetic field components measured by MFI/WIND, and the solid lines represent the fit curve.
Current usage metrics show cumulative count of Article Views (full-text article views including HTML views, PDF and ePub downloads, according to the available data) and Abstracts Views on Vision4Press platform.
Data correspond to usage on the plateform after 2015. The current usage metrics is available 48-96 hours after online publication and is updated daily on week days.
Initial download of the metrics may take a while.