Fig. 8
Download original image
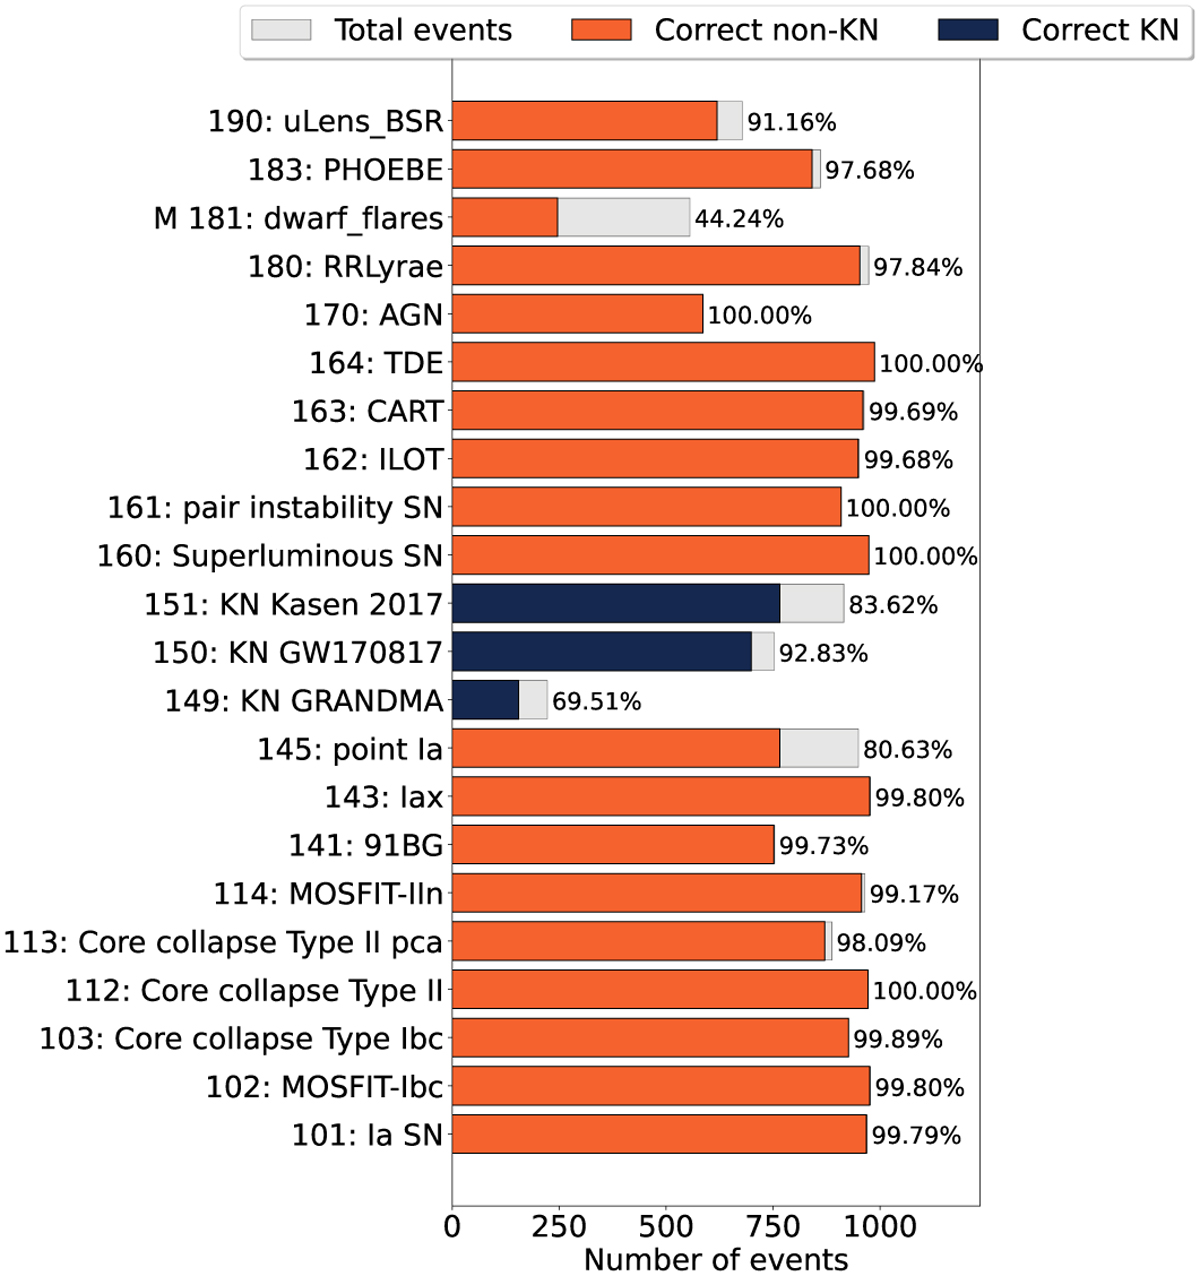
Classification results for the long light-curve baseline scenario. The classifier was trained following a binary configuration of the training set (KN vs non-KN). We show the results separated by class in order to allow for a better understanding of the contaminants. The plot shows the SNANA code and class names as a function of the number of elements in the test sample. Each bar corresponds to the total number of objects of each class in the test sample. Orange bars denote non-KN and blue bars correspond to KN models. The number to the right of each bar reports the percentage of events correctly classified for each class.
Current usage metrics show cumulative count of Article Views (full-text article views including HTML views, PDF and ePub downloads, according to the available data) and Abstracts Views on Vision4Press platform.
Data correspond to usage on the plateform after 2015. The current usage metrics is available 48-96 hours after online publication and is updated daily on week days.
Initial download of the metrics may take a while.