Fig. C.1
Download original image
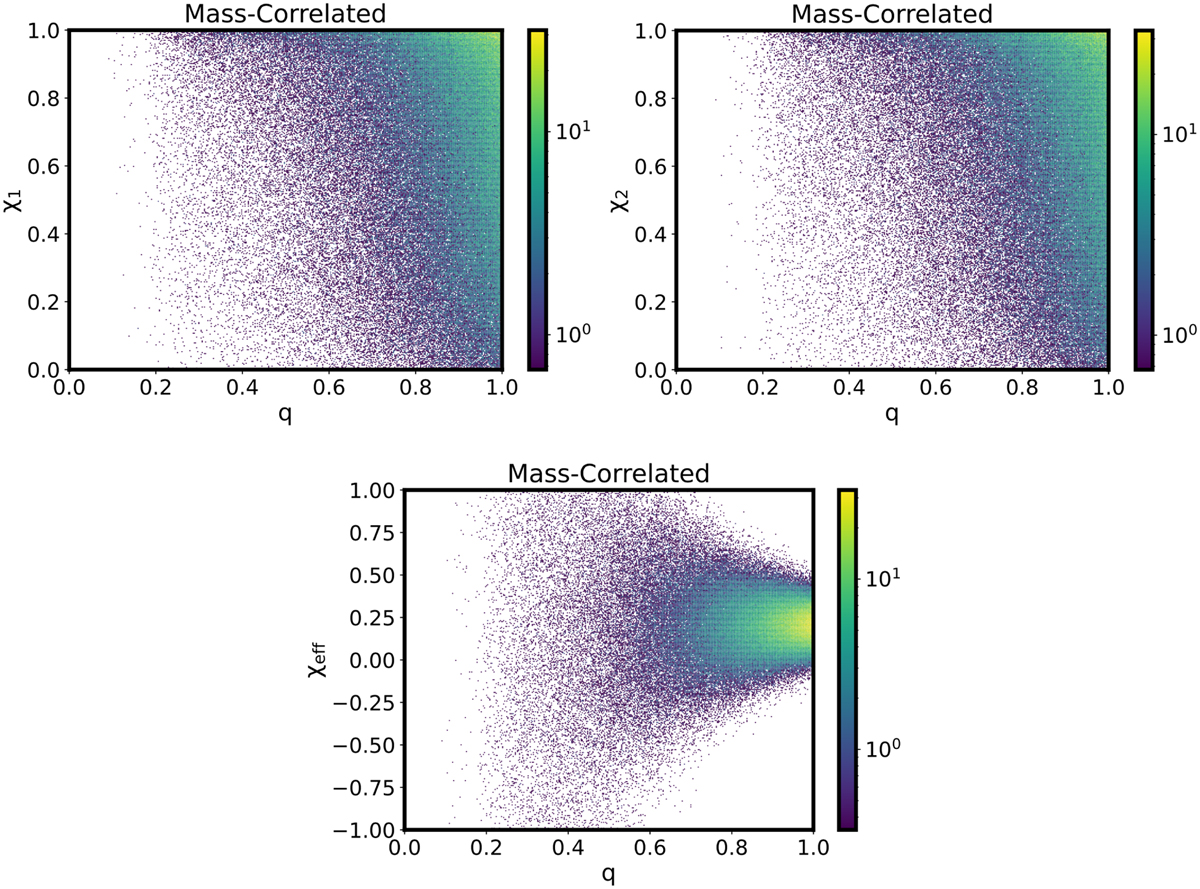
2D distribution of the spin sampling for the case of the mass correlated model. Top figures: Individual spin amplitudes χ1 (left) and χ2 (right) as a function of the mass ratio q. Bottom: Effective spin amplitude, χeff, as a function of the mass ratio, q. The distributions are calculated with αs = 0.013,βs = −1.53,χ0 = 0.2, σ0 = 0.52. The mass distribution is the power-law+Gaussian distribution seen in A.1.
Current usage metrics show cumulative count of Article Views (full-text article views including HTML views, PDF and ePub downloads, according to the available data) and Abstracts Views on Vision4Press platform.
Data correspond to usage on the plateform after 2015. The current usage metrics is available 48-96 hours after online publication and is updated daily on week days.
Initial download of the metrics may take a while.