Fig. B.1
Download original image
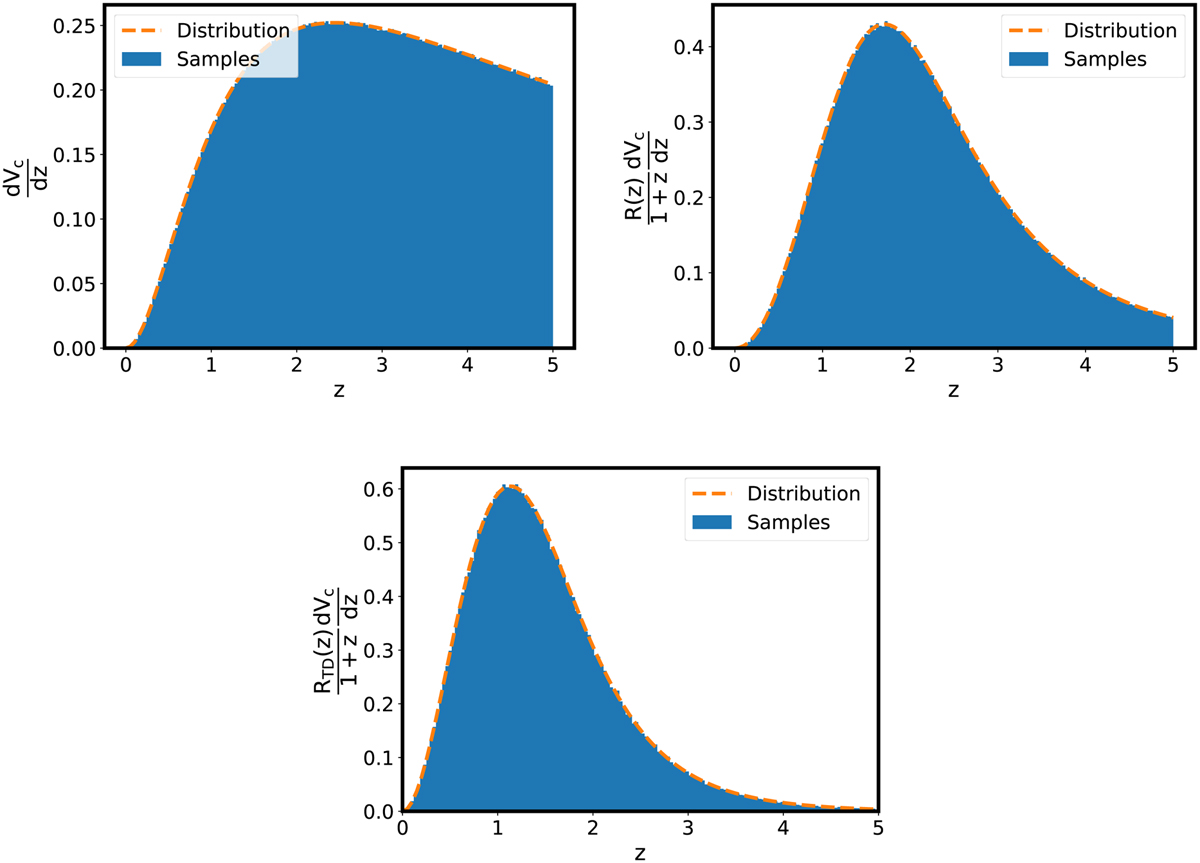
Empirical distribution of the redshift samples draws (in blue) from the uniform in comoving volume distribution (top left), the merger rate model of Eq. 2 (top right) for zp = 1.9, γ = 2.7, Κ = 2.9, and the merger rate model in the case of time delay model described by Eq. 4 (bottom) for d = −1, ![]() Gyrs. The analytical expressions of the distributions are plotted in orange dashed curves. Results obtained using the parameters values given in Table 4.
Gyrs. The analytical expressions of the distributions are plotted in orange dashed curves. Results obtained using the parameters values given in Table 4.
Current usage metrics show cumulative count of Article Views (full-text article views including HTML views, PDF and ePub downloads, according to the available data) and Abstracts Views on Vision4Press platform.
Data correspond to usage on the plateform after 2015. The current usage metrics is available 48-96 hours after online publication and is updated daily on week days.
Initial download of the metrics may take a while.