Fig. A.1
Download original image
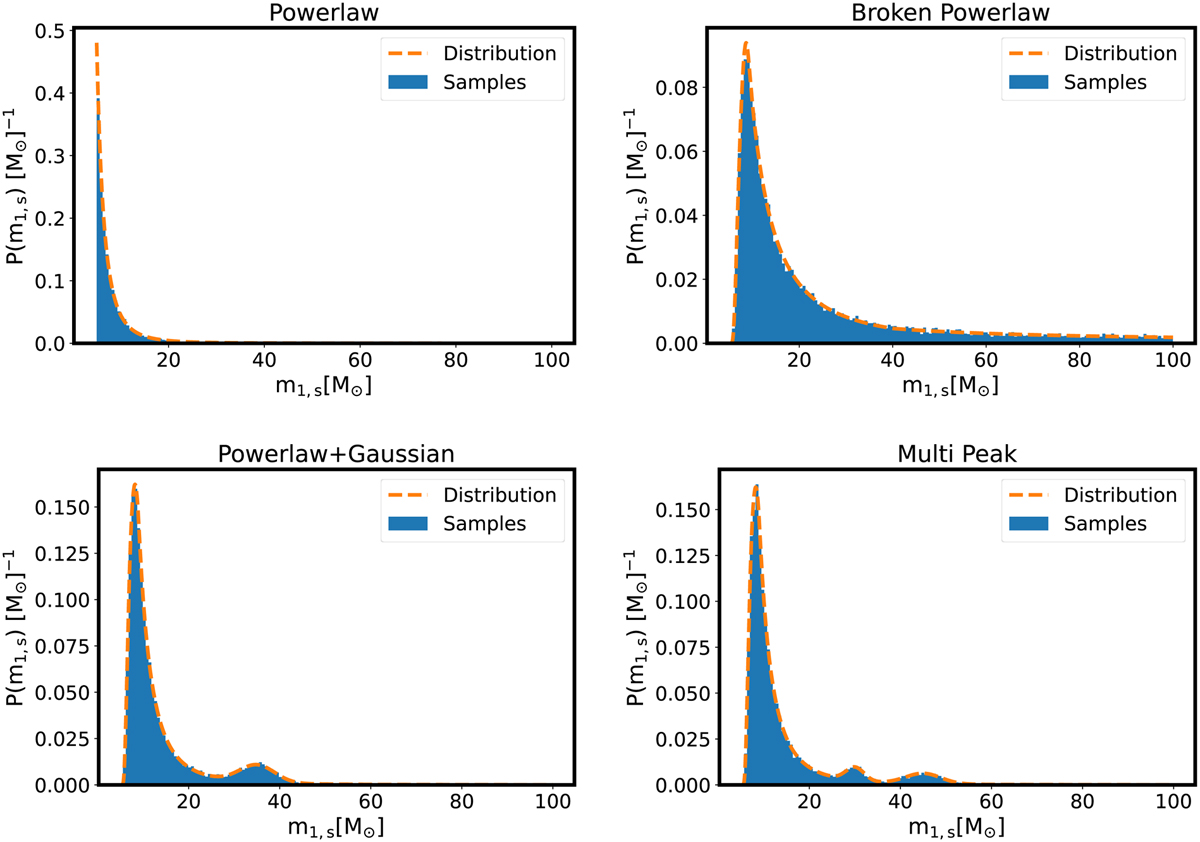
Empirical distributions (in blue) of the source-frame mass samples drawn from various mass distributions. The analytical expressions of the distributions are plotted in orange dashed curves. Top-left: Truncated power-law model. Top-right: broken-power law model with smoothing at the lower end of the distribution. Bottom-left: a power-law+Gaussian peak model with smoothing at the lower end of the distribution. Bottom-right: a multi-peak model with smoothing at the lower end of the distribution.
Current usage metrics show cumulative count of Article Views (full-text article views including HTML views, PDF and ePub downloads, according to the available data) and Abstracts Views on Vision4Press platform.
Data correspond to usage on the plateform after 2015. The current usage metrics is available 48-96 hours after online publication and is updated daily on week days.
Initial download of the metrics may take a while.