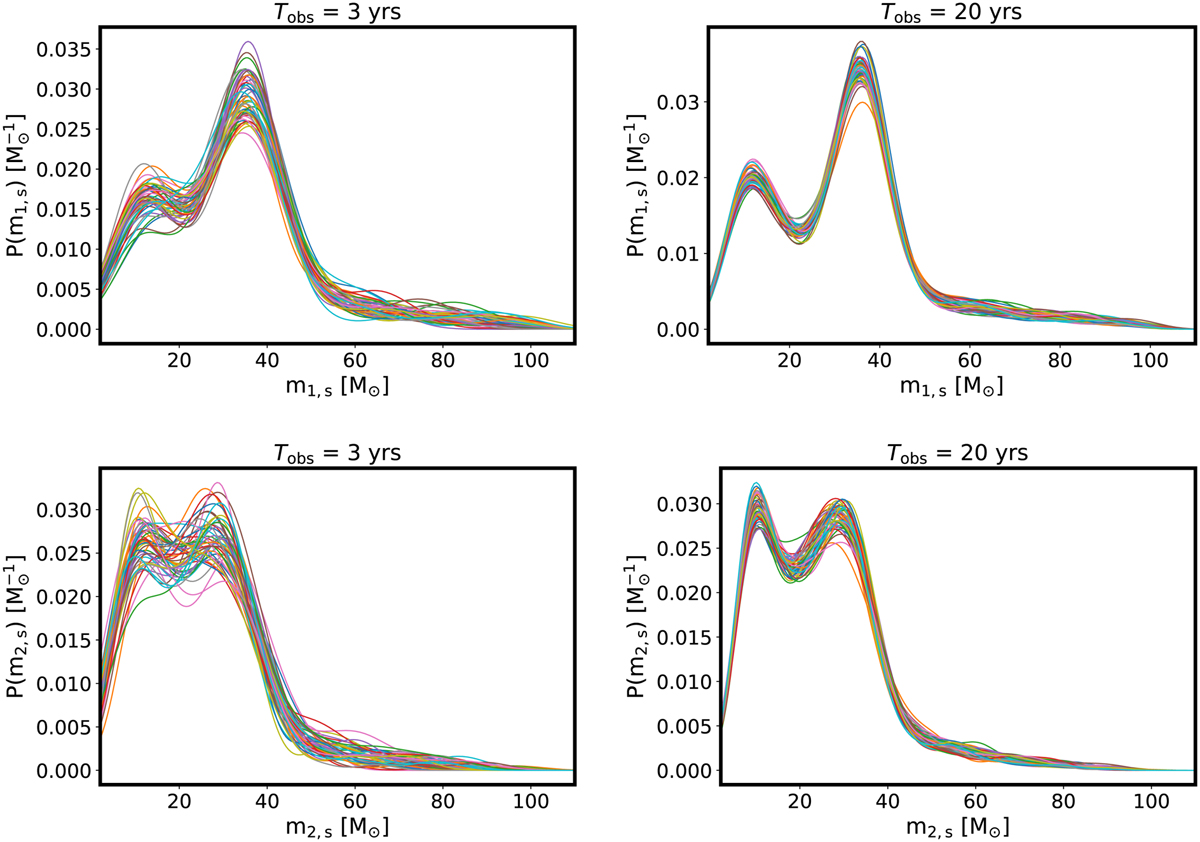
Fig. 6
Download original image
Various m1 (top) and m2 (bottom) distributions of the detected events with (S/N) > 12 for Tobs = 3 yr (left) and Tobs = 20 yr (right) produced for different random seeds. Raising the total observational time leads to more events being detected and the distributions being better defined. The population, cosmological, merger rate, and detector parameters used are given in Table 4 and the corresponding distributions are represented by the orange lines of Fig. 4.
Current usage metrics show cumulative count of Article Views (full-text article views including HTML views, PDF and ePub downloads, according to the available data) and Abstracts Views on Vision4Press platform.
Data correspond to usage on the plateform after 2015. The current usage metrics is available 48-96 hours after online publication and is updated daily on week days.
Initial download of the metrics may take a while.